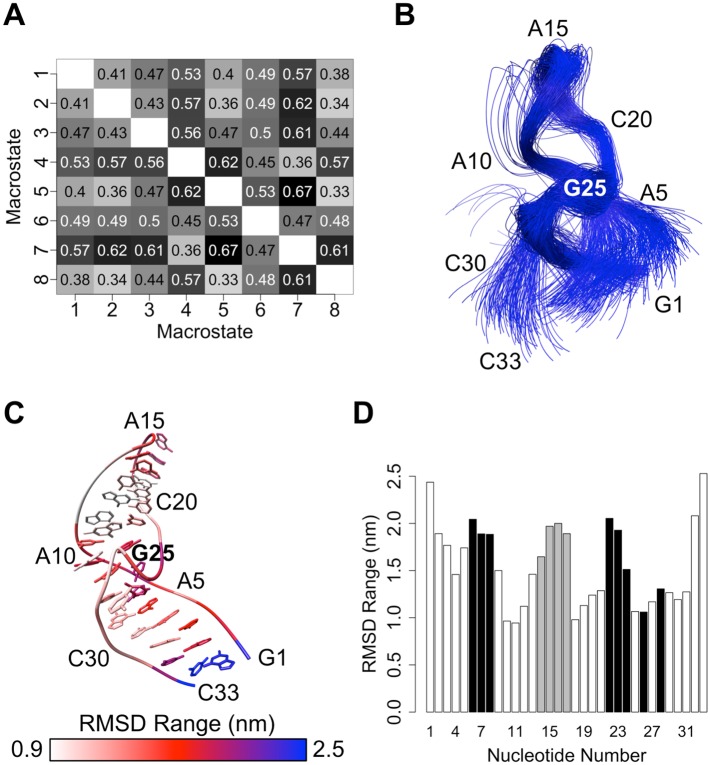
Fig 6. Variability of RNA tertiary structure in the unbound state.
(A) All-versus-all root-mean-squared deviation (RMSD) chart for pairs of macrostates. Average main chain RMSD values (in nm) for all conformations within each macrostate pair are listed. (B) Main chain overlay of 50 conformations selected randomly from each macrostate. (C) Main chain RMSD ranges of individual nucleotides relative to the reference NMR structure after main chain fitting. The NMR structure is depicted, and per-nucleotide RMSD ranges are colored by nucleotide. (D) Bar plot of ranges of RMSD values of individual nucleotides relative to the NMR structure after main chain fitting. Bars corresponding to nucleotides in the theophylline binding site and nucleotides of the GAAA tetraloop are colored black and gray, respectively.

