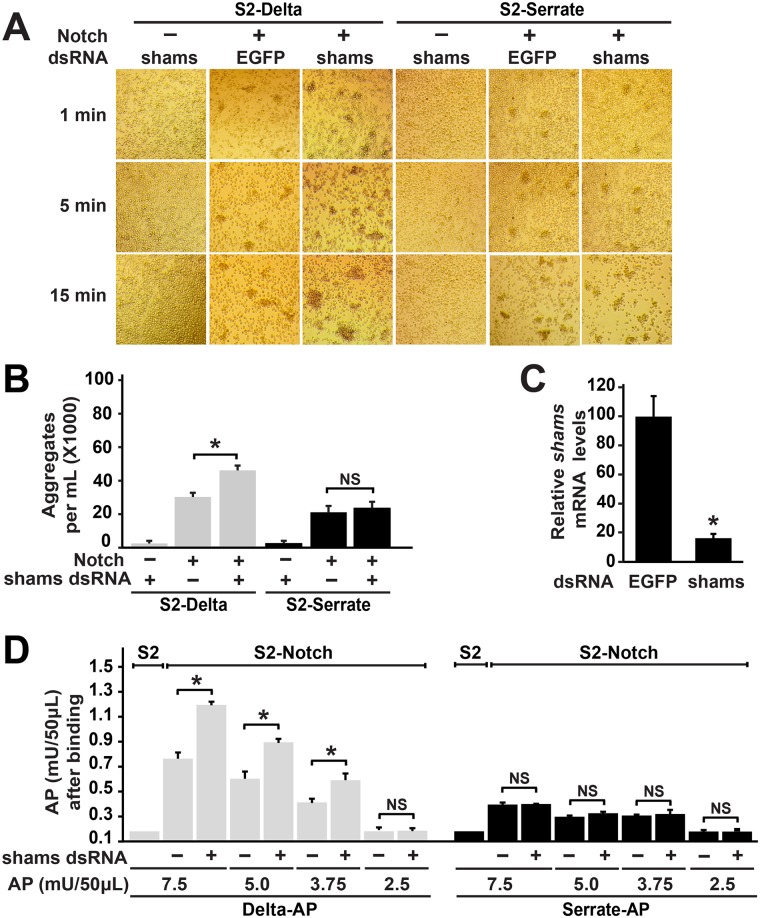
Fig 6. Cell-based aggregation and binding assays indicate increased binding between trans-Delta and Notch upon shams knockdown.
(A) Representative images of co-culture assays between the indicated cell types at 1, 5 and 15 minutes are shown. (A) Shams KD in S2-N cells enhances their aggregation with S2-Dl cells but not with S2-Ser cells. (B) Quantification of number of cell aggregates greater than 6 cells after 5 minutes of co-culture. Error bars indicate standard error. Shams KD in S2-N cells increases the number of aggregates with S2-Dl cells but not with S2-Ser cells. *P<0.01, NS: not significant. (C) Relative shams mRNA levels are measured by qRT-PCR in S2 cells treated with either the control EGFP dsRNA or shams dsRNA. *P<0.01. (D) Graph shows the average AP (Delta-AP or Serrate-AP) units bound to S2 cells (control) and S2-N cells (treated with EGFP or shams dsRNA). Error bars indicate standard error. Shams KD in S2-N cells increases binding with Delta-AP but not with Serrate-AP. *P<0.01, NS: not significant.

