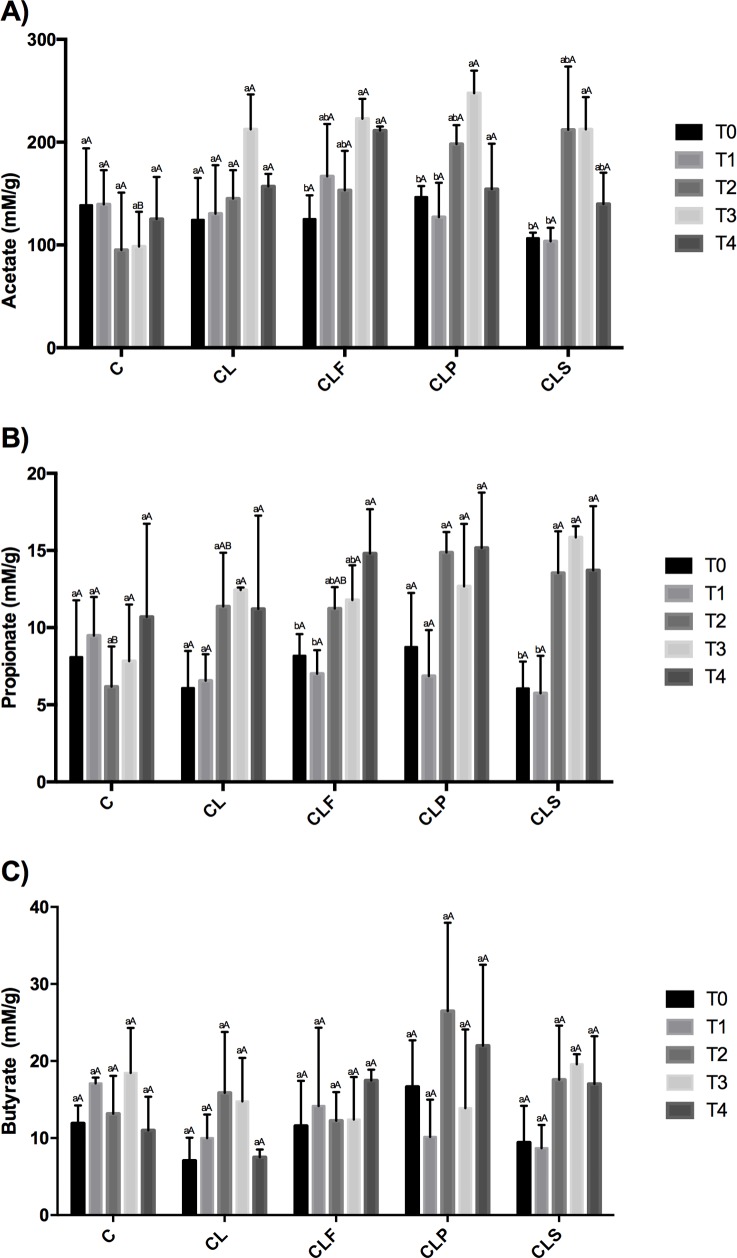
Fig 6. Fecal SCFA concentration (mM/g) from different groups throughout the experimental period.
Same lowercase letters indicate that there was no difference when comparing times. Same capital letters indicate that there was no difference when comparing groups (Tukey test, p<0.05). Group C: healthy animals that did not receive the products under study. Group C: negative control–healthy animals; Group CL: positive control—DSS; Group CLF: DSS with the fermented product; Group CLP: DSS with the non-fermented product (placebo); Group CLS: DSS with sulfasalazine. T0 = before products administration, T1 = one week after products administration, T2 = colitis induction period, T3 = one week after the end of the induction T4 = at the end of the experiment. A = acetate, B = propionate, C = butyrate.

