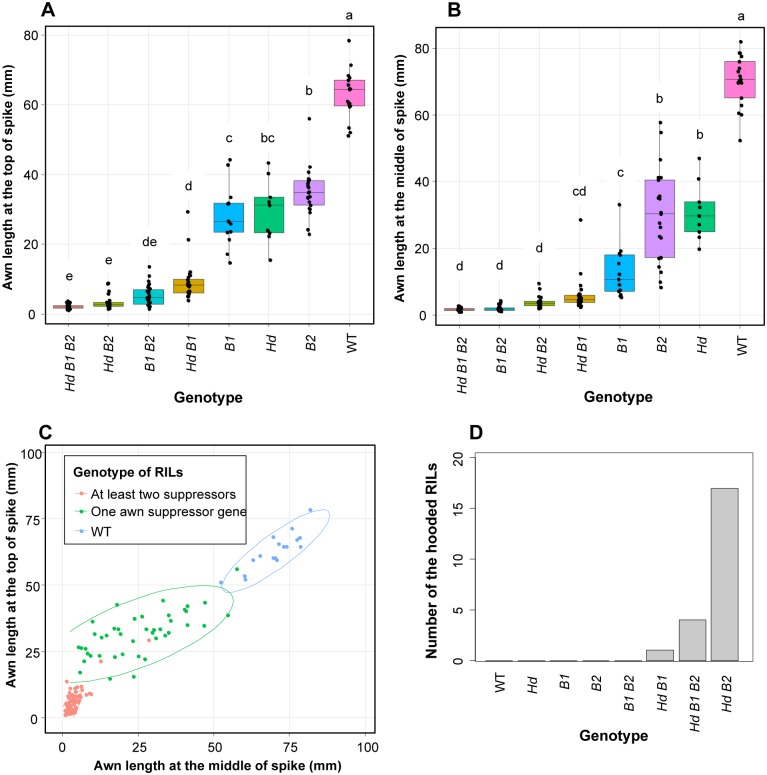
Fig 3. Comparison of awn length and hooded phenotype among different genotypes of RILs.
Comparison of awn length at (A) the top and (B) the middle of the spike for the eight combinations of Hd, B1, B2 and WT alleles in RILs. ANOVA with a post-hoc Tukey’s HSD test was performed and genotypes with the same letter did not present significant differences in awn length (P < 0.05). The phenotypic data of the parental lines (CS [Hd B2] and M808 [B1]) are indicated by red dots. (C) Scatter plot of awn length at the top (y-axis) with respect to that of the middle of the spike (x-axis). Three groups are observed: WT (blue dots), RILs with one of the dominant awning inhibitor alleles (green) and RILs with at least two dominant alleles (pink). Awn length of the parental lines are indicated by black dots. (D) Frequency distribution of RILs with hooded phenotype according to genotype.

