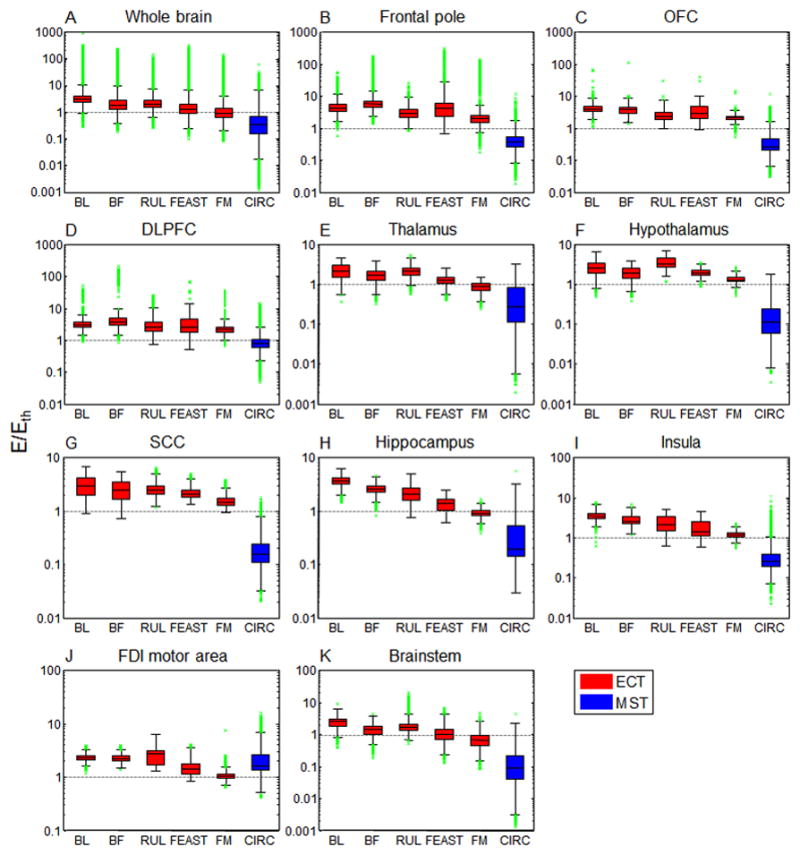
Figure 3.

Descriptive statistics of stimulation strength (E/Eth) in specific brain ROIs for the configurations depicted in Figure 2. Boxes indicate the interquartile range (25th to 75th percentile) with the median marked by a horizontal black line. Whiskers delimit approximately the 99.3 percentile of the E-field distribution. Outliers beyond this range are plotted in green. Horizontal gray dotted lines demarcate the boundary between subthreshold and suprathreshold stimulation strength. The ECT results are for ultrabrief pulse width (0.3 ms); for brief pulse width (1 ms), the stimulation strength should be multiplied by 1.17 [17]. OFC: orbitofrontal cortex, DLPFC: dorsolateral prefrontal cortex, SCC: subcallosal cingulate cortex, FDI: first dorsal interosseous.
