
Figure 4. Glycolysis controls posterior elongation of the embryonic axis.
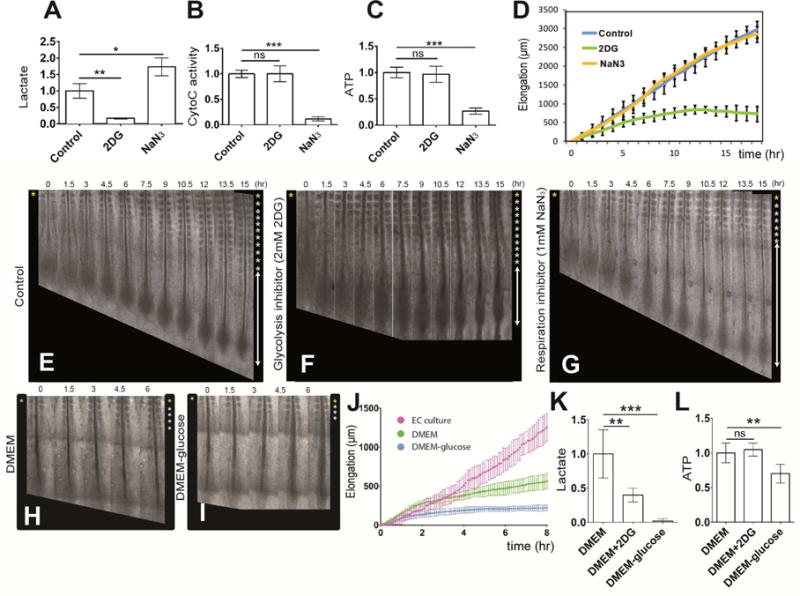
(A–C) Enzymatic detection of relative lactate level (A), of cytochrome C oxidase activity (B) and of relative ATP concentration (C) in the posterior region of control 2-day old chicken embryos and in embryos treated with 2DG or NaN3 (n=6 embryos for each condition). Graphs represent triplicate experiments. Values are normalized by untreated control embryos. Error bars are ±SD. Statistical significance was assessed with one way ANOVA followed by Tukey’s test, **p<0.01, ***p<0.001, ns p>0.5)
(D) Increase in axis length (elongation) measured over time using time lapse microscopy (mean ±SD). Blue, control embryos (n=8); green, 2DG-treated embryos (n=7); yellow, NaN3-treated embryos (n= 5).
(E–G) Elongation time course in a control (E), in a 2DG-treated (F) and in a NaN3-treated (G) 2-day chicken embryo. Bright field micrographs of the posterior region of a chicken embryos taken at 1.5 hour intervals. Somites formed at the last time point are indicated by asterisks on the right. Ventral views, anterior to the top. See also Movie S1 (H–I) Elongation time course in chemically defined DMEM-based culture with 0.15% glucose (H), and without glucose (I). Bright field micrographs of the posterior region of 2-day chicken embryos taken at 1.5 hour intervals. Somites formed at the last time point are indicated by asterisks on the right. Ventral views, anterior to the top.
(J) Increase in axis length (elongation) measured over time using time lapse microscopy (mean ±SD). Magenta, embryos in EC culture (n=5); green, embryos in defined 0.15% glucose DMEM-based cultures (n=4); blue, embryos in defined DMEM-based culture without glucose (n= 5).
(K,L) Enzymatic detection of relative lactate level (K) and of relative ATP concentration (L) in the posterior region of control 2-day old chicken embryos and in embryos cultured in defined DMEM-based medium with or without 0.15% glucose and in 2DG treated embryos (n=4 embryos for each condition). Graphs represent quadruple experiments. Values are normalized to 0.15% glucose embryos. Error bars are ±SD. Statistical significance was assessed with one way ANOVA followed by Tukey’s test, **p<0.01, ***p<0.001, ns p>0.5)
See also Figure S3