
Figure 3.
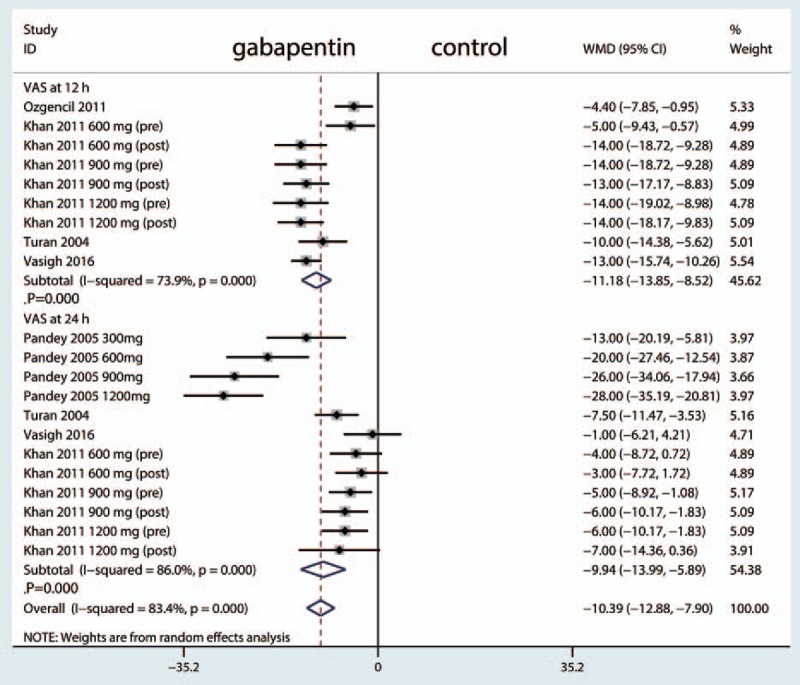
(A) Forest plots of the included studies comparing the VAS at 12 h. B, Forest plots of the included studies comparing the VAS at 24 h. VAS = visual analog scale.
Official websites use .gov
A
.gov website belongs to an official
government organization in the United States.
Secure .gov websites use HTTPS
A lock (
) or https:// means you've safely
connected to the .gov website. Share sensitive
information only on official, secure websites.
(A) Forest plots of the included studies comparing the VAS at 12 h. B, Forest plots of the included studies comparing the VAS at 24 h. VAS = visual analog scale.