
Figure 7.
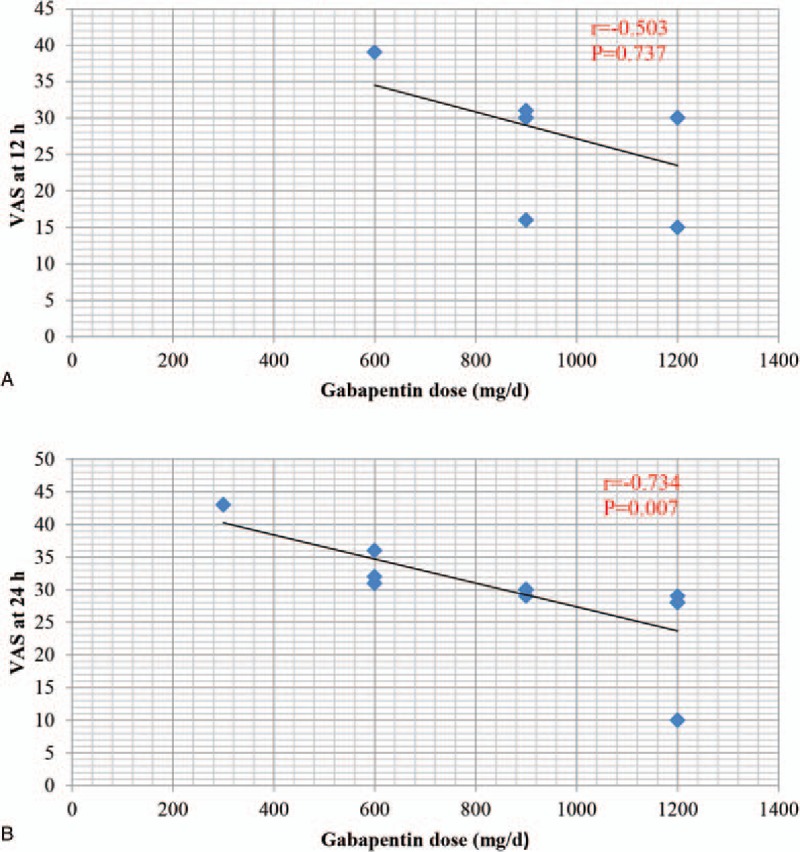
(A) Scatter plot showing the relationship between the dose of gabapentin and the VAS at 12 h. (B) Scatter plot showing the relationship between the dose of gabapentin and the VAS at 24 h. VAS = visual analog scale.
Official websites use .gov
A
.gov website belongs to an official
government organization in the United States.
Secure .gov websites use HTTPS
A lock (
) or https:// means you've safely
connected to the .gov website. Share sensitive
information only on official, secure websites.
(A) Scatter plot showing the relationship between the dose of gabapentin and the VAS at 12 h. (B) Scatter plot showing the relationship between the dose of gabapentin and the VAS at 24 h. VAS = visual analog scale.