
Figure 2.
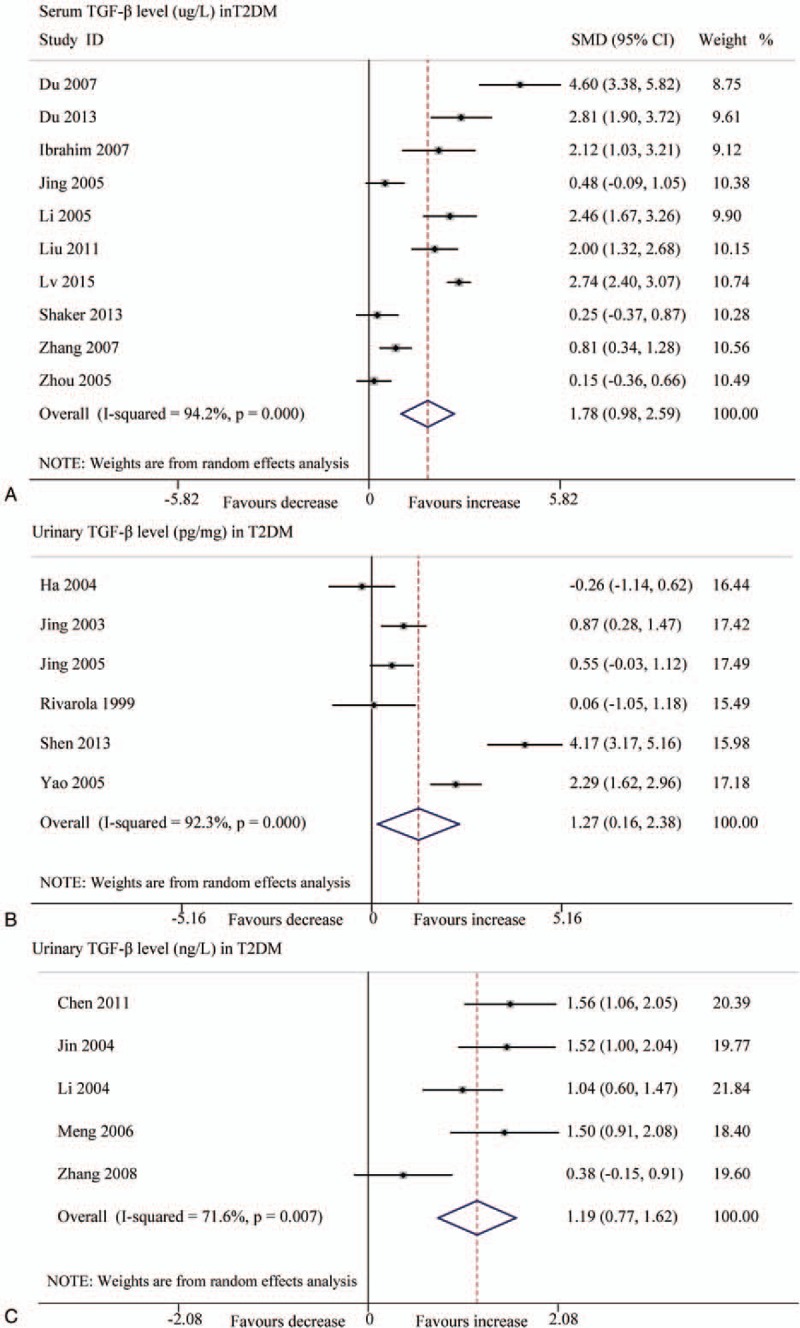
Forest plots for the level of TGF-β1 between T2DM patients and controls with random-effects model. (A) TGF-β1 level (μg/L) in serum (SMD 1.78, 95% CI 0.98–2.59, P < .001); (B) TGF-β1 level (pg/mg.creatinine) in urinary (SMD 1.27, 95% CI 0.16–2.38, P < .001); (C) TGF-β1 level (ng/L) in urinary (SMD 1.19, 95% CI 0.77–1.62, P < .001). CI = confidence interval, SMD = standard mean difference, T2DM = type 2 diabetes mellitus, TGF-β1 = transforming growth factor beta 1.