
Figure 4.
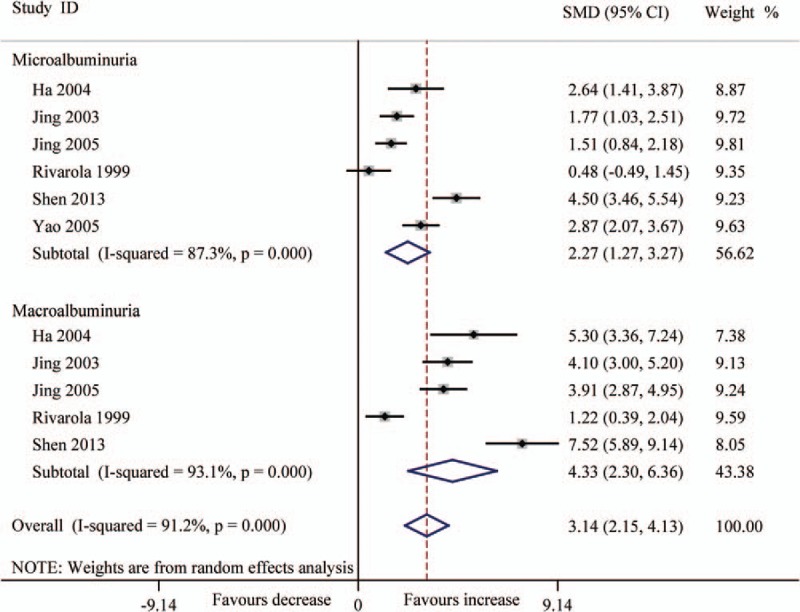
Forest plots for the level (pg/mg.creatinine) of urinary TGF-β1 between T2DN patients and controls with random-effects model. Microalbuminuria (SMD 2.27, 95% CI 1.27–3.27, P < .001), macroalbuminuria (SMD 4.33, 95% CI 2.30–6.36, P < .001), overall (SMD 3.14, 95% CI 2.15–4.13, P < .001). CI = confidence interval, SMD = standard mean difference, T2DN = type 2 diabetic nephropathy, TGF-β1 = transforming growth factor beta 1.