
Figure 6.
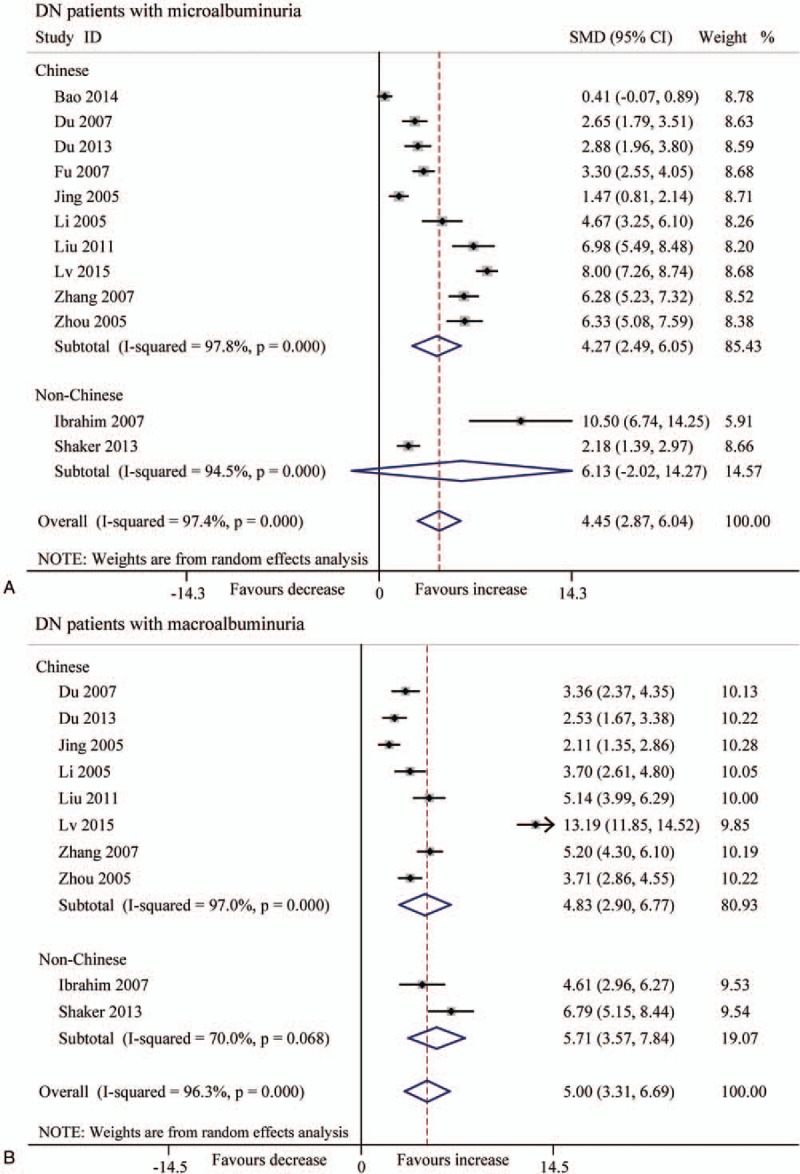
Forest plots for the level (μg/L) of serum TGF-β1 between T2DN patients and controls with random-effects model. (A) Microalbuminuria (Chinese: SMD 4.27, 95% CI 2.49 to 6.05, P < .001; non-Chinese: SMD 6.13, 95% CI −2.02 to 14.27, P = .140). (B) Macroalbuminuria (Chinese: SMD 4.83, 95% CI 2.90–6.77, P < .001; non-Chinese: SMD 5.71, 95% CI 3.57–7.84, P < .001). CI = confidence interval, SMD = standard mean difference, T2DN = type 2 diabetic nephropathy, TGF-β1 = transforming growth factor beta 1.