
Figure 7.
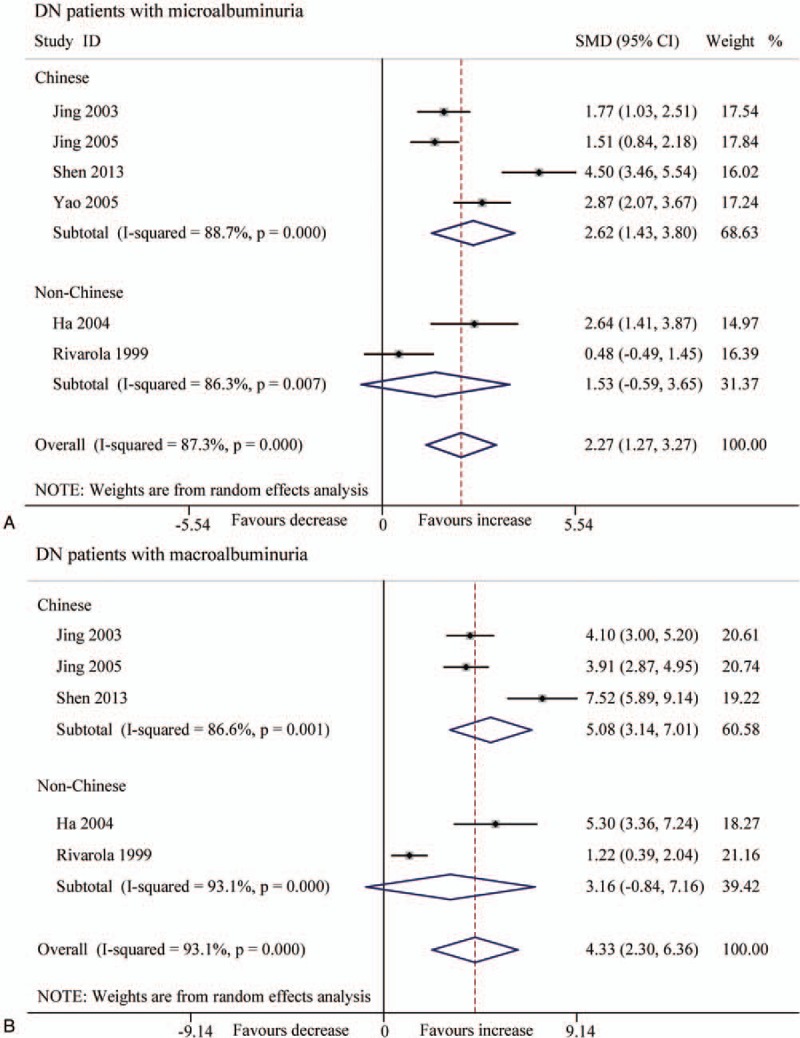
Forest plots for the level (pg/mg.creatinine) of urinary TGF-β1 between T2DN patients and controls with random-effects model. (A) Microalbuminuria (Chinese: SMD 2.62, 95% CI 1.43 to 3.80, P < .001; non-Chinese: SMD 1.53, 95% CI −0.59 to 3.65, P = .157). (B) Macroalbuminuria (Chinese: SMD 5.08, 95% CI 3.14 to 7.01, P < .001; non-Chinese: SMD 3.16, 95% CI −0.84 to 7.16, P = .121). CI = confidence interval, SMD = standard mean difference, T2DN = type 2 diabetic nephropathy, TGF-β1 = transforming growth factor beta 1.