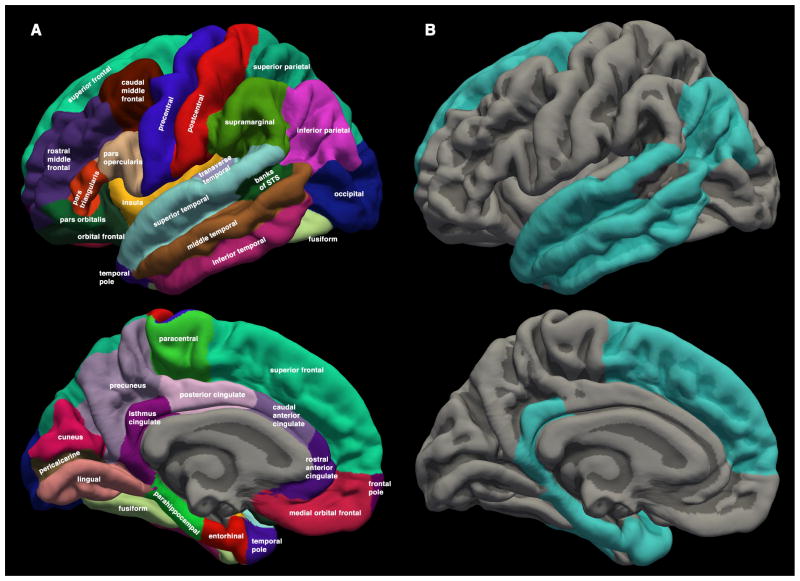
Figure 1.
(A) Cortical regions from the Desikan-Killiany atlas available in the FreeSurfer neuroimaging software suite. Regions are displayed on the FreeSurfer average brain for illustration, but statistical analyses were carried out using the corresponding regions delineated in the native MRI space of each patient. Average radiation dose and average cortical thickness change were calculated for each region. (B) Cortical regions with significant radiation dose-dependent cortical atrophy in linear mixed-effects model. FreeSurfer average brain surface shown in gray (light gray for gyrus, dark gray for sulcus). Regions statistically significant after correction for multiple comparisons are colored. Only the left hemisphere is shown for convenience, but statistical tests included bilateral observations.

