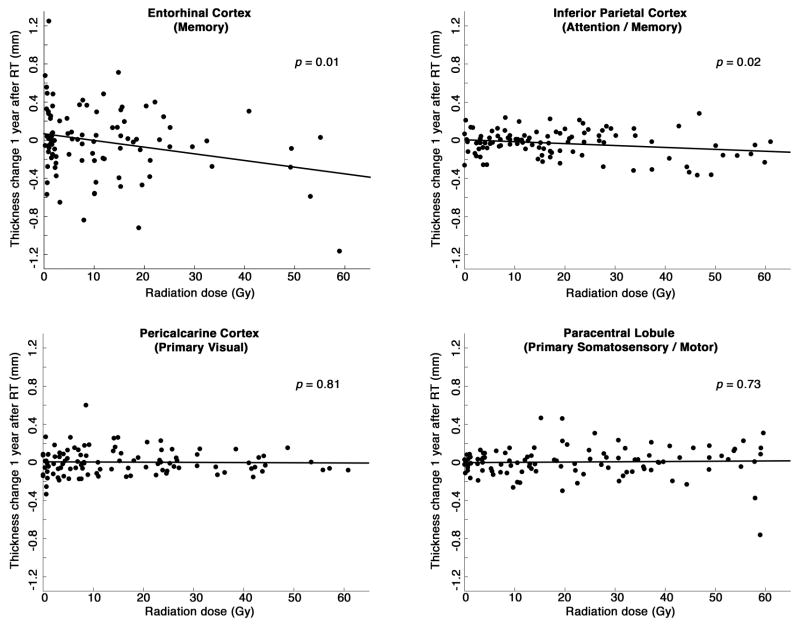
Figure 2.
Cortical thickness change vs. radiation dose for four regions of interest. Thickness change is the mean change from pre-radiation baseline to approximately one year after start of radiation therapy. Radiation dose is the mean dose to that region of cortex. Stated (two-sided) p-values are for the hypothesis that thickness decreases with increasing radiation dose. Regression slopes (±SE): entorhinal −7.1 ± 2.7 μm/Gy; inferior parietal −2.0 ± 0.8 μm/Gy; pericalcarine −0.2 ± 0.9 μm/Gy; paracentral 0.3 ± 0.8 μm/Gy.

