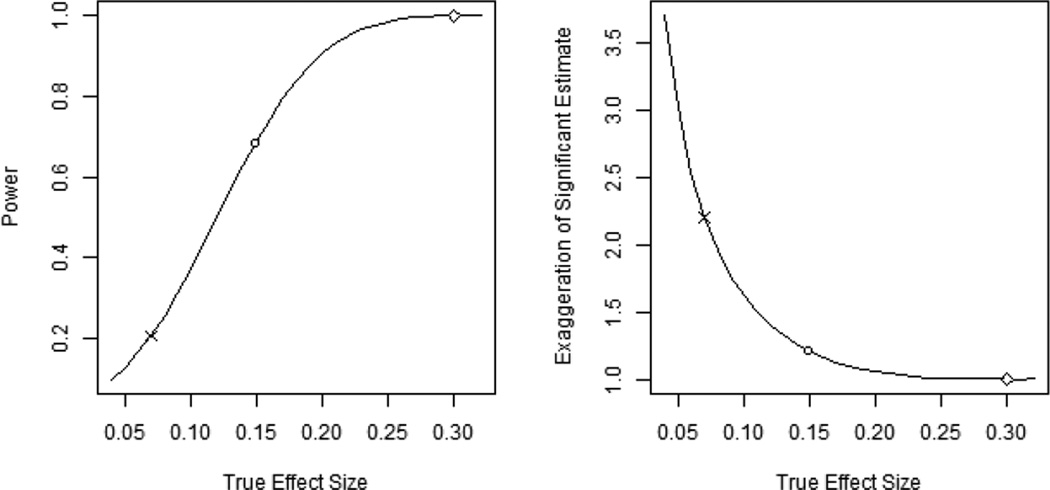
Figure 4. Power Calculations for Range of True Effect Sizes of Self-affirmation Intervention Effects.
Notes: Curves represent power (left panel) and expected exaggeration of a treatment effect estimate significant at the 0.05 level (right panel) for self-affirmation effects in grade 8, given the design for new study (cohort 2) reported here. Calculations are based on the procedure suggested by Gelman and Carlin (2014). Diamonds represent an effect size of 0.3, consistent with the initial study of self-affirmation interventions (Cohen et al. 2006); if true effects are this large, then power is virtually 1.0 and expected exaggeration is minimal. Circles represent the estimated effect size for the first cohort of students (d = 0.15). If the true effect were this large, then cohort 2 power would be 0.68 and expected exaggeration would be 1.21. Xs represent the mean effect size calculated in Figure 1 (d = 0.07). If the true effect were this large, power would be 0.21 and significant values would exaggerate the true effect by 2.22 times on average.

