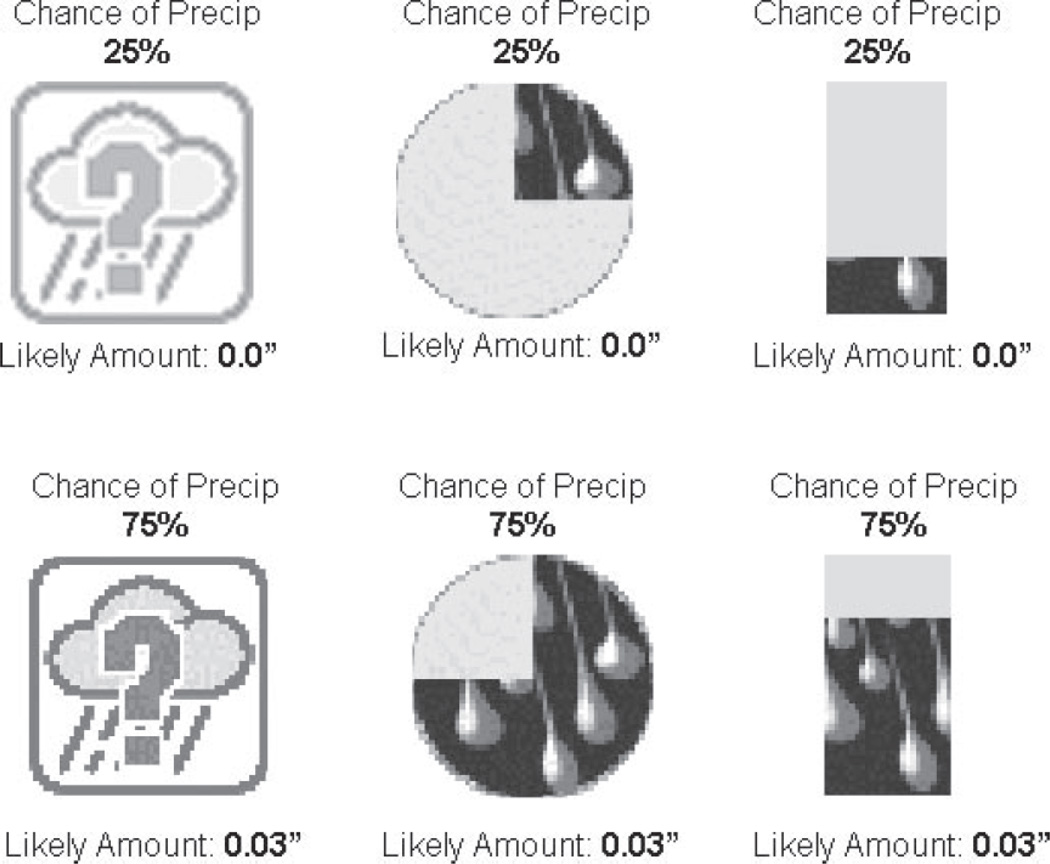
Figure 4.
Icons used in cognitive experiments to compare the relative effectiveness of different icons for probability of precipitation: question mark icon (where the icon is darker when the probability is higher), pie icon and bar icon. Source: [24].

