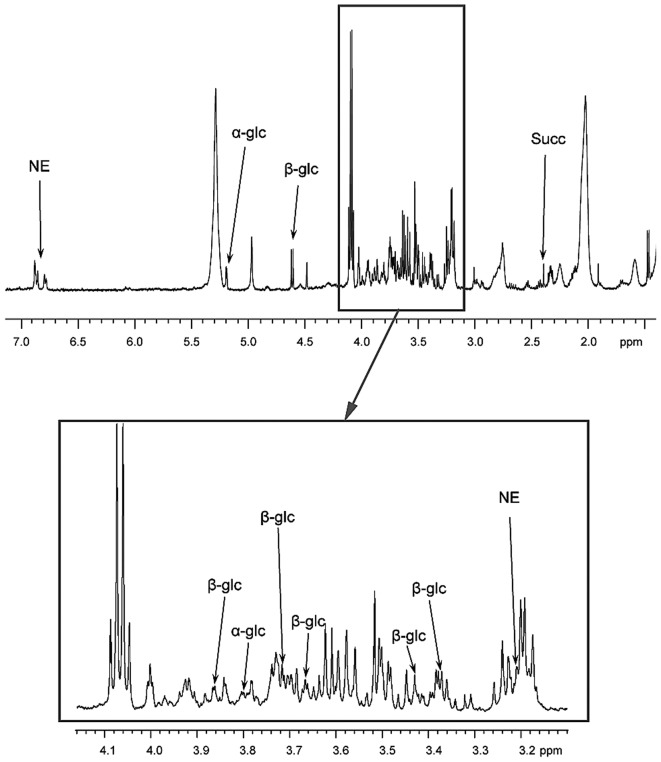
Figure 2.
Results of HRMAS NMR spectroscopy (500 MHz) performed on tumor samples from the organ of Zuckerkandl paraganglioma. Partial metabolite assignment is indicated. The metabolic content may be directly compared as the spectrum intensity was normalized with respect to the weight of each examined sample. For display purposes, the amplitude of the lactate peak at 4.09 ppm has been cut out. The top image shows a representative spectrum with highly elevated levels of α-glc and β-glc. Spectrum regions ranging from 3.10–4.15 ppm are magnified in the lower box. Amongst catecholamines, only an NE signal was detected in all the examined tissue samples. Finally, the level of Succ was low, which confirmed the absence of a succinate dehydrogenase complex deficiency. HRMAS, 1H-high-resolution magic-angle-spinning; NMR, nuclear magnetic resonance; α-glc, α-glucose; β-glc, β-glucose; NE, norepinephrine; Succ, succinate.

