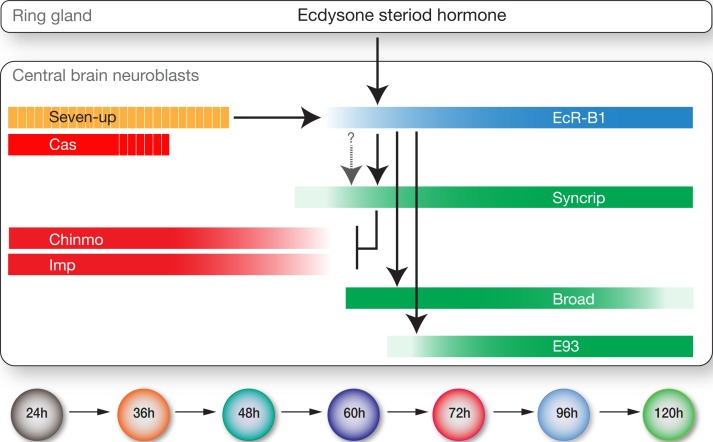
Figure 9. Model showing hormonal regulation of early to late temporal transitions in central brain larval neuroblasts.
Summary of regulatory interactions driving larval neuroblast early-to-late temporal factor expression. Arrows indicate positive regulation; ‘T’ indicates negative regulation; dashed bars indicate asynchronous expression during the indicated temporal window; gradients indicate graded change in expression levels.

