. 2017 Mar 31;6:e21763. doi: 10.7554/eLife.21763

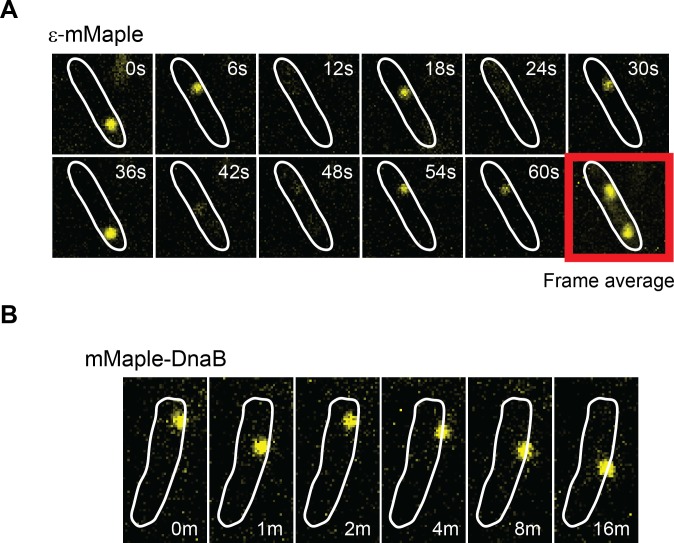
Figure 3. DnaB may serve as a platform for frequent Pol III* subassembly re-binding.

(A) Representative example of a cell where a single activate copy of ε-mMaple shows multiple cycles of binding and unbinding (time in seconds). Obtained from an experiment using 2 s intervals between consecutive images. Frame average shows the cellular location of two replisomes. (B) Example of a cell where a single activated mMaple-DnaB molecule remains localized as a focus for several minutes (time in minutes). Obtained from an experiment using 10 s intervals between consecutive images. Boundaries of the cells at the beginning of the experiment are shown as white outlines.

DOI: http://dx.doi.org/10.7554/eLife.21763.012

Figure 3.

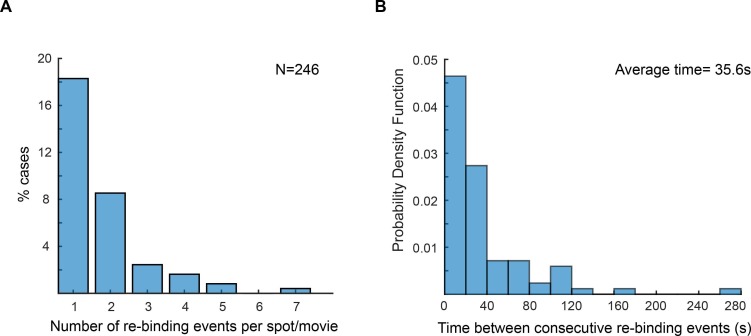
Figure 3—figure supplement 1. Re-binding of copies of ε at the same position are unexpectedly frequent.

Figure 3—figure supplement 1.

(A) Plot showing the number of rebinding events during a single experiment. (B) Distribution of gap times, calculated from data obtained using 2 s exposure time. Rebinding analysis was done similarly to the track linkage analysis, except no frame threshold was applied. Time between re-binding events was obtained by determining the time interval between the end of a single-molecule track and the beginning of a new track at the same position in the cell. Note that in reality the frequency of binding will likely be higher, since molecules have a similar probability of binding to a different replisome between consecutive events. We manually analysed cells with two replisome spots and estimated that 52% of consecutive spot reappearance events occur at a different position in cells with two replisomes (N = 30 cells; 199 re-binding events).