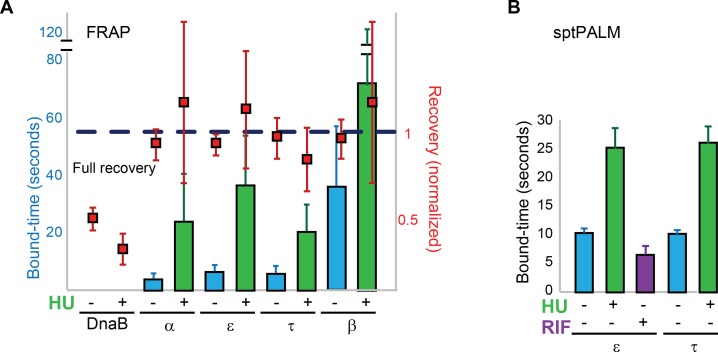
Figure 4. Replisome dynamics are partly dependent on active DNA synthesis.
(A) Summary of the average bound-times in cells treated with HU, estimated by FRAP. The results for untreated (blue bars) and treated cells (green bars) is shown. Data for the untreated condition is presented to facilitate comparison and is identical to that in Figure 1D. Red squares represent the normalised level of fluorescence recovery. Dashed blue line shows estimated maximum possible recovery. It was not possible to estimate the bound-time for DnaB. (B) Summary of bound-times estimated by sptPALM (weighted average). Results for the untreated (blue bars) and treated cells (green bars) is shown. Data obtained using cells treated with the RNA Polymerase inhibitor Rifampicin is also shown for cells carrying ε-mMaple (purple bars). Data for the untreated condition is presented to facilitate comparison and is identical to that in Figure 2D. Error bars represent SE.

