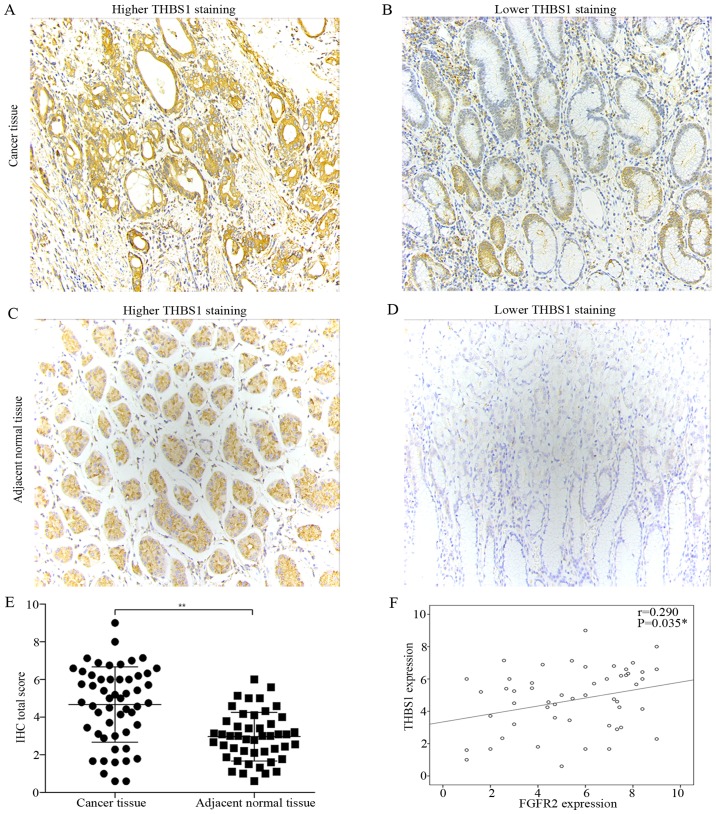
Figure 2.
Expression of THBS1 in paired tumor and adjacent normal tissues, and correlation analysis between FGFR2 and THBS1 expression. (A–D) Representative micrographs showing higher THBS1 staining and lower THBS1 staining in human gastric cancer tissue (A and B) and adjacent normal tissues (C and D) (magnification, ×200). (E) Quantification of THBS1 expression in tumor tissues compared with adjacent normal tissues. Data are presented as the mean ± SD (**P<0.01). (F) Correlation analysis of FGFR2 and THBS1 expression.

