Figure 2.
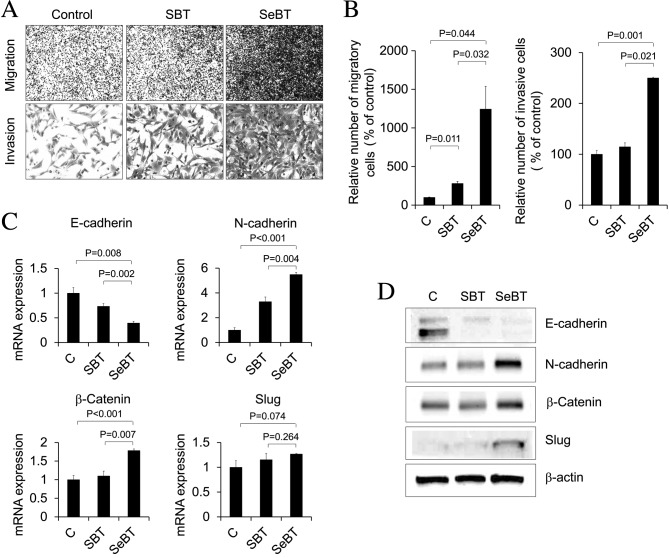
Enhanced cellular migration and invasion following sequential treatment with Bix in U251 cells. (A) Images of migratory (upper panel) and invasive (bottom panel) cells under phase contrast microscopy (magnification, ×200) are shown. (B) The number of migratory and invasive cells was counted and presented. Values are presented as the mean ± standard deviation. Representative data from three independent trials. (C) E-cadherin, N-cadherin, β-catenin and Slug mRNA expression patterns under SBT or SeBT were assessed by reverse transcription-quantitative polymerase chain reaction analysis. Results represent mRNA levels normalized to the levels of β-actin mRNA. Relative E-cadherin, N-cadherin, β-catenin and Slug mRNA levels are presented as the mean ± standard deviation of three independent experiments. (D) Western blot analysis demonstrated the change in total protein expression of E-cadherin, N-cadherin, β-catenin and Slug. The expression level of β-actin was used as loading control. Bix, BIX01294; SBT, single treatment of Bix; SeBT, sequential treatment of Bix; Slug, zinc finger protein SNAI2; C, control.

