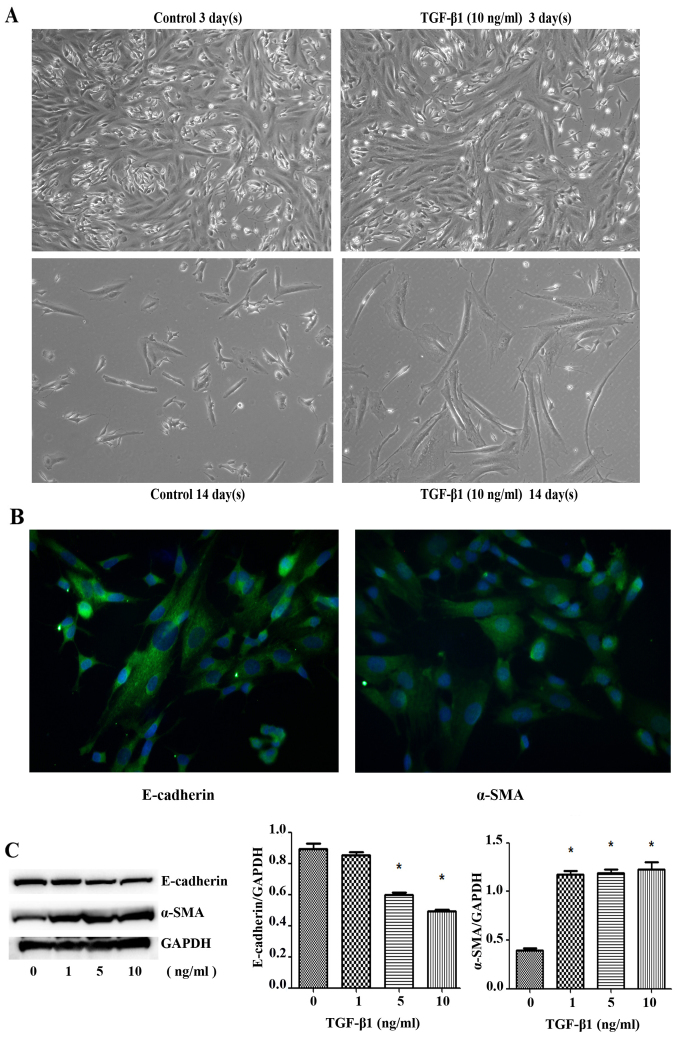
Figure 1.
Cell morphology changes and E-cadherin/α-SMA was expressed in SK-N-SH cells. (A) The SK-N-SH cells were stimulated with TGF-β1 at 10 ng/ml for 3 or 14 days. The cells showed morphology changes from epithelial to mesenchymal transition (scale bar, 100 µm). (B) The expression of E-cadherin and α-SMA detected by immunofluorescence assay (scale bar, 50 µm). (C) The SK-N-SH cells were stimulated with TGF-β1 at 0, 1, 5 and 10 ng/ml, the cells were subsequently collected and subjected to western blot analysis. GAPDH served as a loading control. Columns, mean of three experiments; bars, ± SD. *P<0.05.

