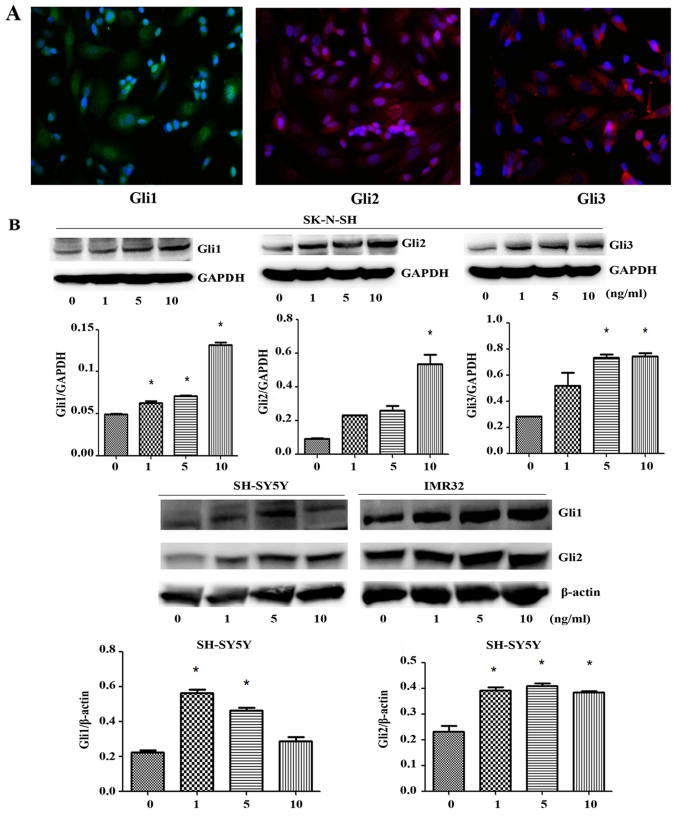
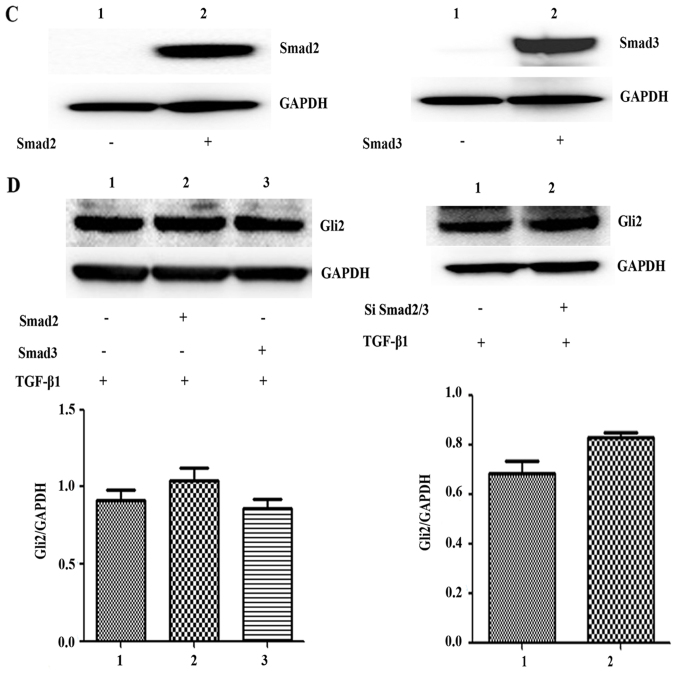
Figure 4.
Immunofluorescence and western blot analysis confirmed that Gli are expressed in neuroblastoma cell lines. (A) The expression of Gli1/2/3 in SK-N-SH cells was detected by immunofluorescence assay, the green, red and red fluorescence represent the transcription factors Gli1, Gli2 and Gli3 respectively (scale bar, 50 µm). (B) The SK-N-SH, SH-SY5Y, and IMR-32 cells were plated and treated with TGF-β1 for 72 h, Cells were collected and the cell lysates were subjected to western blot analysis for Gli1/2. (C) The SK-N-SH cells were plated and transfected with Smad2 and Smad3 plasmid respectively. Cells were collected and the cell lysates were subjected to western blot analysis for Smad2 and Smad3. (D) With TGF-β1 stimulation, the SK-N-SH cells were plated and transfected with Smad2 and Smad3 plasmid or with SiSmad2/3 respectively, the Gli2 expression level was measured by western blot analysis. For all western blot analysis, GAPDH/β-actin served as a loading control. Results are representative of three independent experiments. All band intensities were quantified using ImageJ software and shown as the bar graph. Columns, mean of triplicate experiments; bars, ± SD. *P<0.05.


