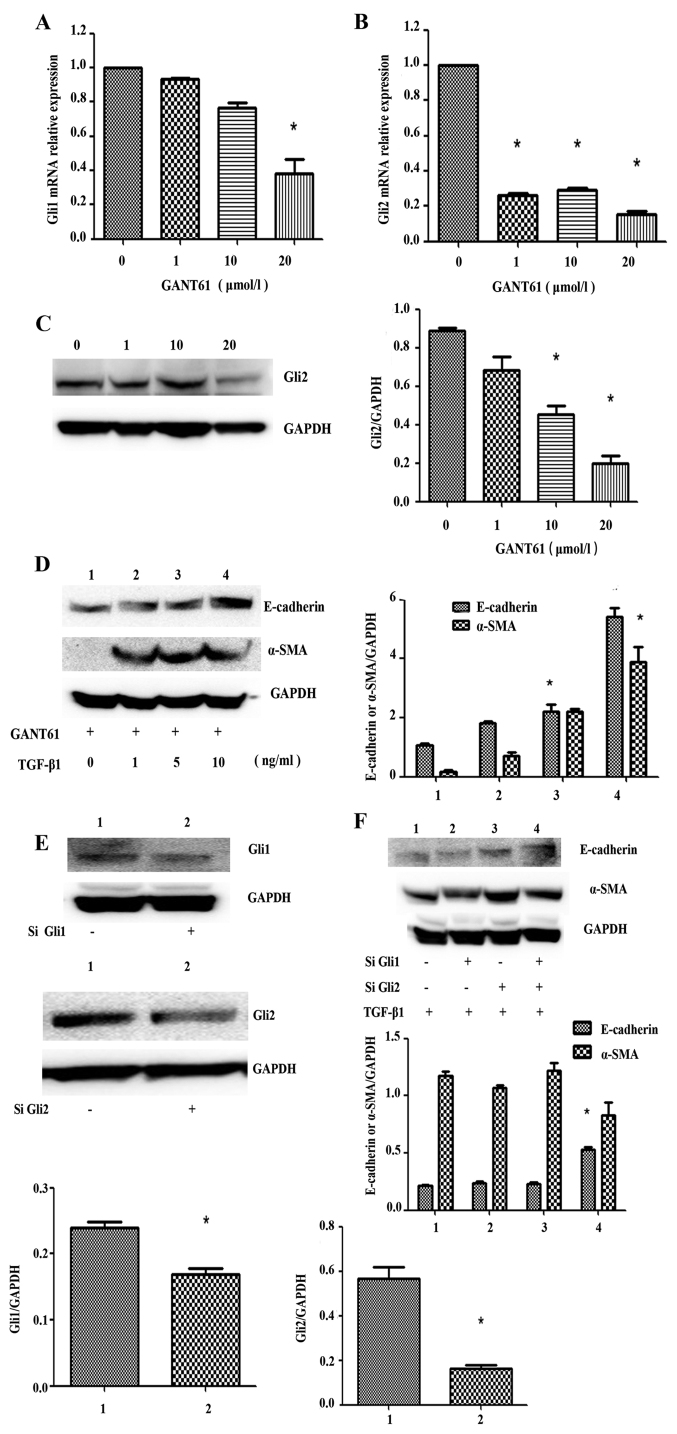
Figure 5.
Gli2 expression level is decreased in SK-N-SH cells treated with Gli2 specific inhibitor GANT61, E-cadherin and α-SMA expression are affected by TGF-β1 after inhibition of Gli1/2. (A and B) The SK-N-SH cells were treated with GANT61 for 72 h, cells were collected and mRNA was extracted, reverse transcription was performed and mRNA level of Gli1/2 was quantified and shown as the bar graph. Columns, mean of triplicate experiments; bars, ± SD. *P<0.05. (C) SK-N-SH cells were treated with GANT61 for 72 h, the protein expression of Gli2 was detected by western blot analysis. (D) The SK-N-SH cells were plated and treated with GANT61 for 72 h. Cells were collected and the cell lysates were subjected to western blot analysis for E-cadherin and α-SMA. (E) The SK-N-SH cells were plated and transfected with SiGli1/2, cells were collected and the cell lysates were subjected to western blot analysis for Gli1/2. (F) With TGF-β1 stimulation, the SK-N-SH cells were plated and transfected with SiGli1/2, after 72-h culture, E-cadherin and α-SMA were detected by western blot analysis. For western blot analysis, GAPDH served as a loading control. Results are representative of three independent experiments. The band was analyzed using ImageJ software and shown as the bar graph. Columns, mean of triplicate experiments; bars, ± SD. *P<0.05.

