
Figure 2.
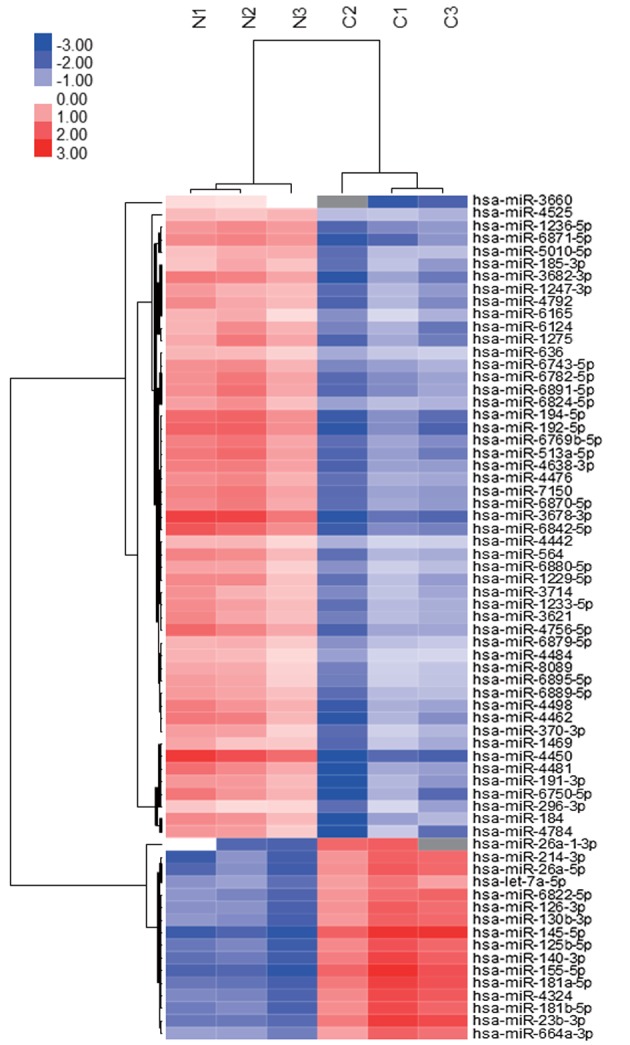
Hierarchical clustering of miRNAs between normal and tumor tissues. Liver tissue miRNA clustering was performed according to the expression profiles of 107 differentially expressed miRNAs between normal and tumor tissues. The analyzed tissue samples are presented in the columns and the miRNAs are presented in the rows. The miRNA-clustering tree is presented on the left and the sample-clustering tree is presented at the top. The color scale depicts the relative expression levels of the miRNAs in the patient tissue samples, with red representing a high expression level and blue representing a low expression level. miRNA, microRNA.