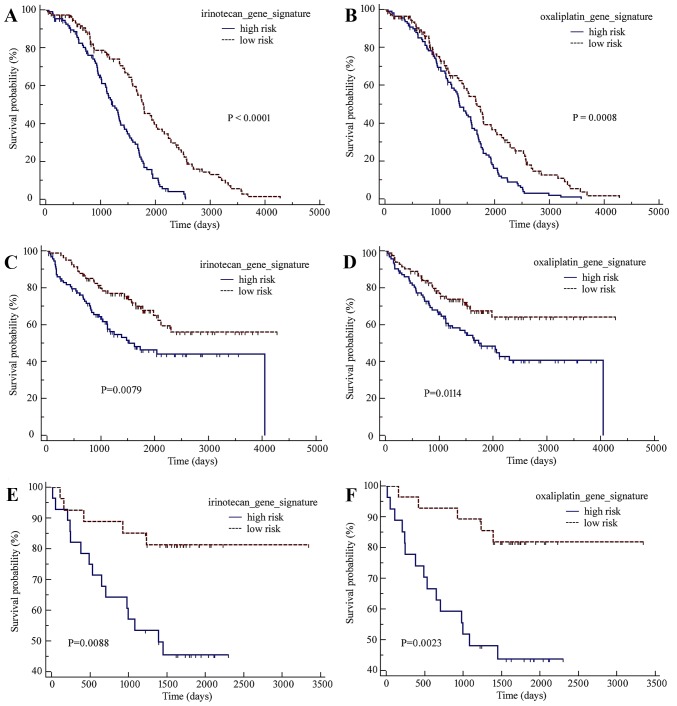
Figure 1.
Kaplan-Meier curves of the low-risk and high-risk subgroups defined by the irinotecan-resistance and oxaliplatin-resistance gene signatures. (A) Irinotecan-resistance signature. (B) Oxaliplatin-resistance signature. The GSE17536 dataset's (C) irinotecan- and (D) oxaliplatin-resistance signatures. The GSE17537 dataset's (E) irinotecan- and (F) oxaliplatin-resistance signatures. These two gene signatures were able to stratify patients with colorectal cancer into low- and high-risk subgroups with significant differences in terms of the prognosis in the GSE14333 training dataset.

