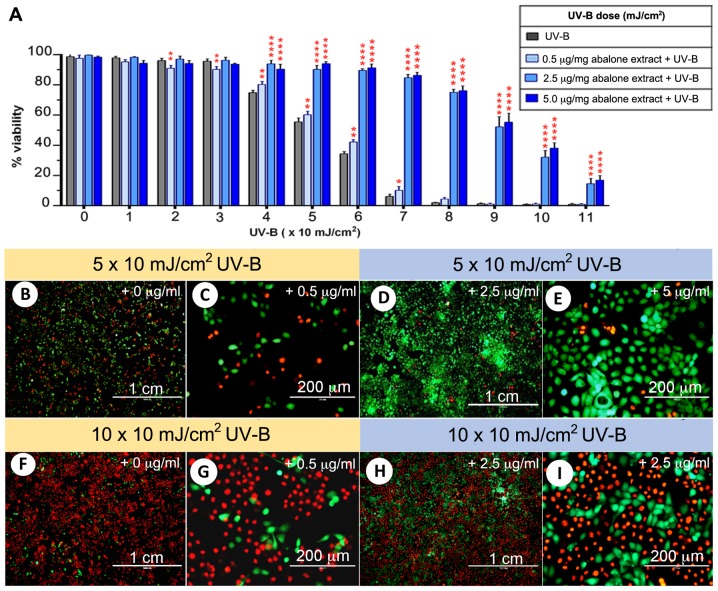
Figure 2.
Analysis of effective doses for abalone HBG and gill extract under UVB and HaCaT cell viability. (A) Graph comparing HaCaT cell viability among the four groups. Significant difference in cell viability when compared to the control group is shown at ****P<0.001, **P<0.01 and *P<0.05. (B-I) Representative images of HaCaT cells treated with UV-B with and without extract, showing live-dead staining as indicated by green and red, respectively. HBG, hypobranchial gland.

