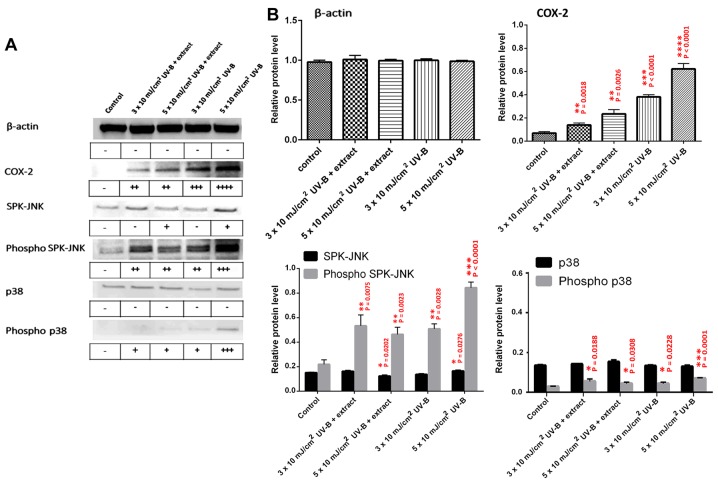
Figure 4.
Western blot analysis of inflammatory-related proteins present in HaCaT cells after UV-B exposure and with abalone extract. (A) Representative western blots, and (B) graphs showing relative protein levels for each protein. Densities of bands (quantified using densitometry UN-SCAN-IT software) were compared to the control group to identify relative change. −, no significant difference; +, significant difference at P<0.05; ++, significant difference at P<0.01; +++, significant difference at P<0.001; and ++++, significant difference at P<0.0001.

