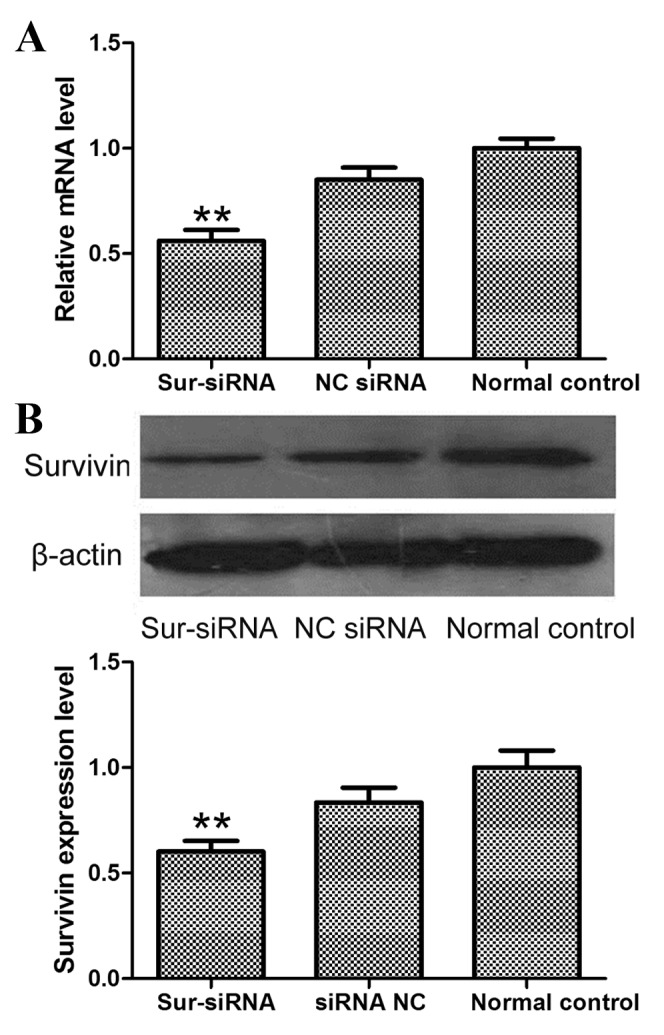
Figure 1.

mRNA and protein expression levels of survivin following siRNA nanoliposome transfection of MHCC-97H cells. (A) mRNA levels were determined using RT-qPCR and (B) protein levels were evaluated using western blot analysis. **P<0.01, vs. the normal control group. siRNA, small interfering RNA; RT-qPCR, reverse transcription-quantitative polymerase chain reaction; sur-siRNA, survivin-targeted siRNA; NC, negative control.
