Figure 3.
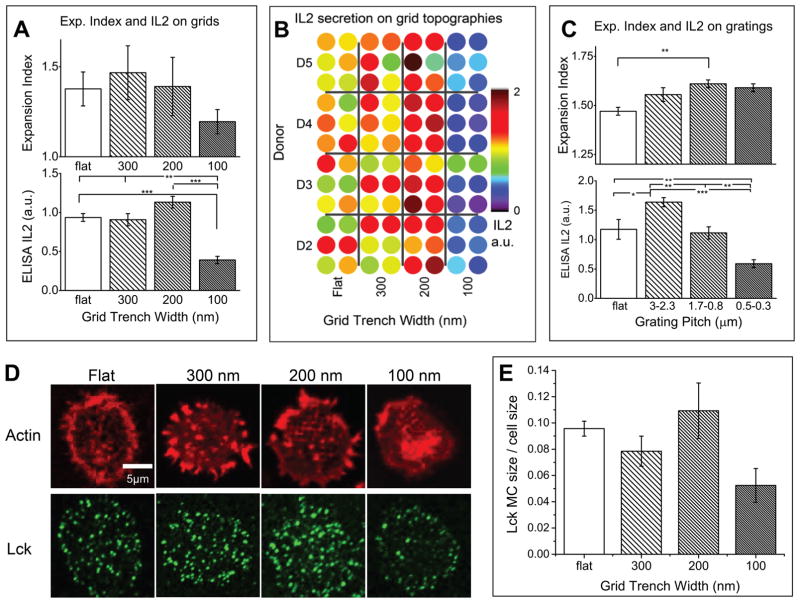
IMP compatibility with plate readers. A. Expansion index and supernatant IL-2 from T cells activated on grating geometries; B. ELISA IL-2 measurements from a well plate with 96 samples of four donors and four different topographies tested; C. Expansion index and supernatant IL-2 from T cells activated on grid topographies after 2–3 days culturing; D. Actin and Lck microcluster staining after 1 h culture on grid patterns; E. Statistical analysis of Lck microcluster size versus total cell size, and the percentage trend correlates with IL-2 secretion shown in A (*, p < 0.01; **, p < 0.005; ***, p < 0.00005).

