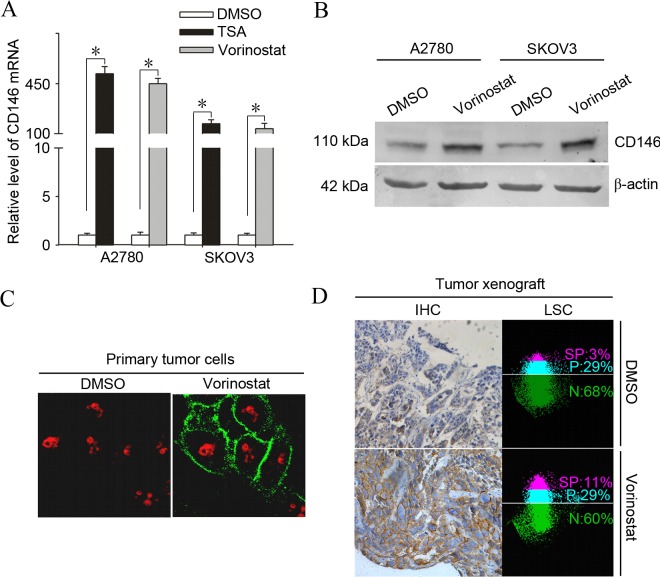
Figure 1.
Induction of the adhesion molecule CD146 is a common phenomenon in vorinostat-treated ovarian cancer cells in vitro and in vivo. (A) A2780 and SKOV3 cells were treated with 2.5 µmol/l vorinostat or 500 nmol/l TSA for 12 h and subjected to analysis of quantitative polymerase chain reaction for the mRNA levels of CD146. Results are normalized to those of 18s RNA and expressed as the fold induction compared with the DMSO-treated group (*P<0.05). (B) A2780 and SKOV3 cells were treated with 2.5 µmol/l vorinostat for 24 h and analyzed for the protein levels of CD146 by western blot analysis. (C) A2780 cells were treated with 2.5 µmol/l vorinostat or DMSO for 12 h and were then analyzed by immunofluorescent analysis for staining of CD146, obtaining representative images under a confocal microscope (magnification, ×600). (D) SKOV3 tumor-bearing mice were treated with 25 mg/kg of vorinostat or DMSO for 24 h and CD146 expression was determined by immunohistochemistry and quantified by laser scanning cytometry. Images represent typical data (Total positive rate for CD146 (SP plus P) is the mean ± standard deviation (n=10). CD146, cluster of differentiation 146; DMSO, dimethyl sulfoxide; TSA, trichostatin A; SP, strong positive; P, positive; N, negative; IHC, immunohistochemistry; mRNA, messenger RNA; LSC, laser scanning cytometry.

