
Fig. 6.
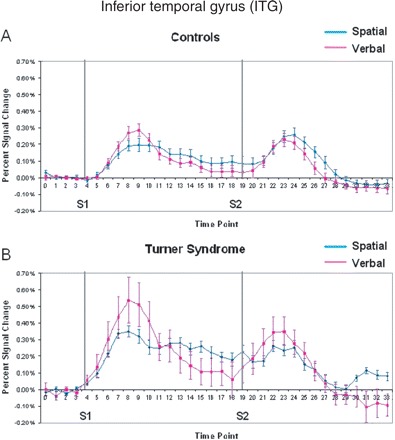
Mean per cent signal change within active voxels for the inferior temporal gyrus in (A) controls and (B) Turner syndrome. Grey lines indicate onset of S1 and S2 periods.
Official websites use .gov
A
.gov website belongs to an official
government organization in the United States.
Secure .gov websites use HTTPS
A lock (
) or https:// means you've safely
connected to the .gov website. Share sensitive
information only on official, secure websites.
Mean per cent signal change within active voxels for the inferior temporal gyrus in (A) controls and (B) Turner syndrome. Grey lines indicate onset of S1 and S2 periods.