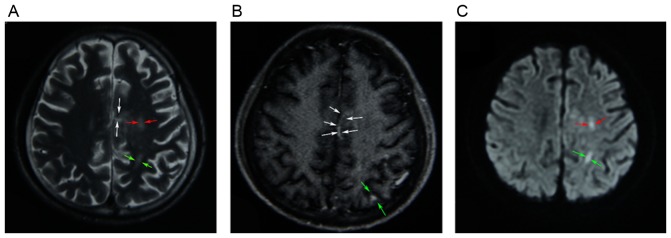
Figure 3.
(A) T2-weighted MR image demonstrating heterogeneous high-signal intensity in the left frontal lobe (red arrows), the left parietal lobe (green arrows) and the corpus callosum (white arrows). (B) Enhanced T1-weighted MR image revealing increased signal intensity of lesions, which were mainly located in the left parietal lobe (green arrows) and the corpus callosum (white arrows). (C) MR diffusion-weighted image showing high signal intensity in the left frontal lobe (red arrows) and the left parietal lobe (green arrows). MR, magnetic resonance.

