Figure 4.
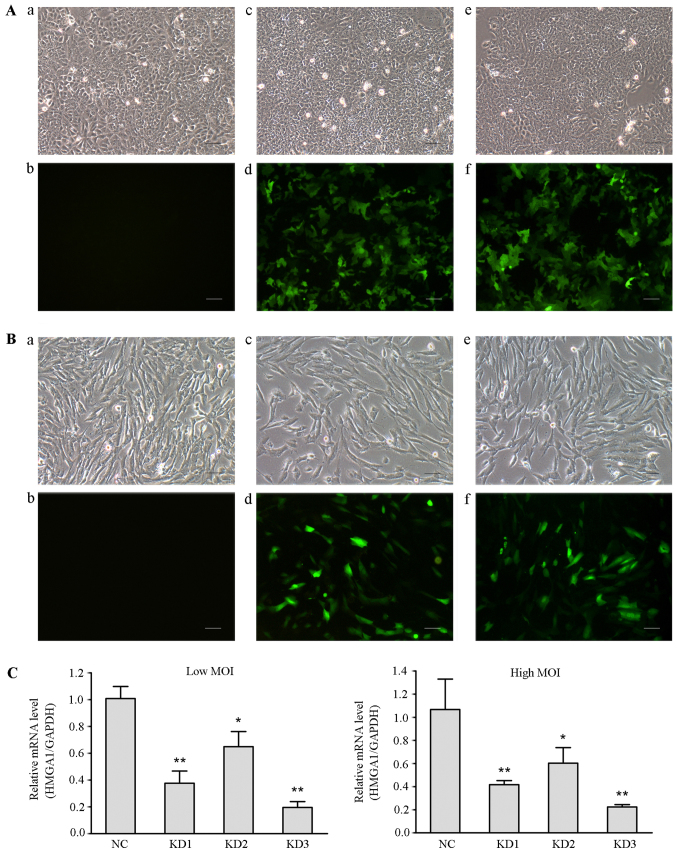
Identification of the lentiviral vector with the highest knockdown efficiency. (A) Fluorescence microscopy was used to observe the infection efficiency of different lentiviral vectors in TPC1 cells (magnification, x100). a, TPC1 cells without lentiviral infection in the optical microscope (Con group); b, TPC1 cells of Con group in the fluorescence microscope; c, TPC1 cells were infected with negative lentivirus NC/GV248 RNAi-LV (NC group) in the optical microscope; d, TPC1 cells of NC group in the fluorescence microscope; e, TPC1 cells were infected with HMGA1/GV248RNAi-LV#3 RNAi (KD group) at a high MOI in the optical microscope; f, TPC1 cells of KD group at a high MOI in the fluorescence microscope. Scale bar, 50 µm. (B) Fluorescence microscopy examination of the infection efficiencies of different lentiviral vectors in SW579 cells (magnification, x100). The panels are described as similar with that in (A). Scale bar, 50 µm. (C) Relative levels of HMGA1 in SW579 cells infected with different groups of lentiviral particles. Either low or high MOI, HMGA1 expression significantly decreased in SW579 cells infected with different groups of lentiviral particles. The highest knockdown efficiency was obtained using KD3 lentiviral particles. *P<0.05, **P<0.01.

