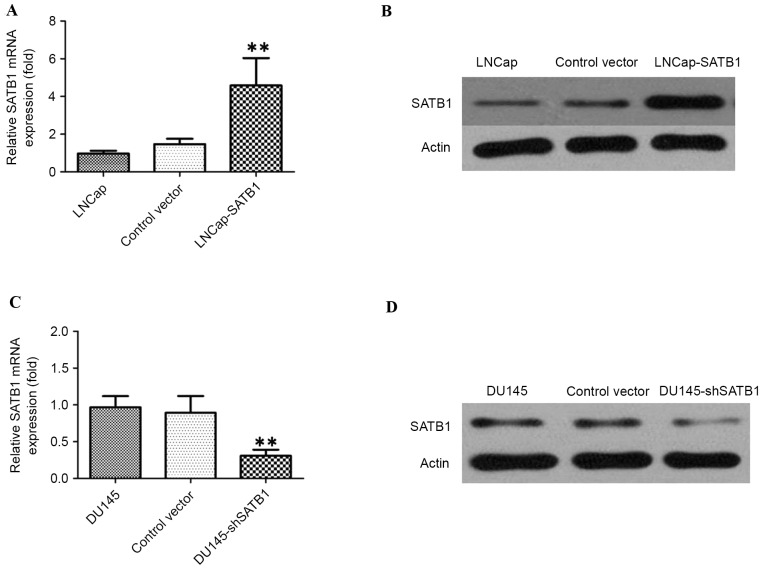
Figure 4.
(A) RT-qPCR demonstrating that expression level of SATB1 mRNA in LNCap-SATB1 cells was significantly increased compared with control cells. **P<0.01. (B) Western blot analysis demonstrating that the expression of SATB1 protein in LNCap-SATB1 cells was significantly increased compared with control cells. (C) RT-qPCR demonstrating that expression level of SATB1 mRNA in DU145-shSATB1 cells was significantly decreased compared with control cells. (D) Western blots analysis demonstrating that the expression of SATB1 protein in DU145-shSATB1 cells was significantly decreased compared with control cells. RT-qPCR, reverse transcription quantitative polymerase chain reaction; SATB1, special AT-rich sequence binding protein; sh, short hairpin RNA.

