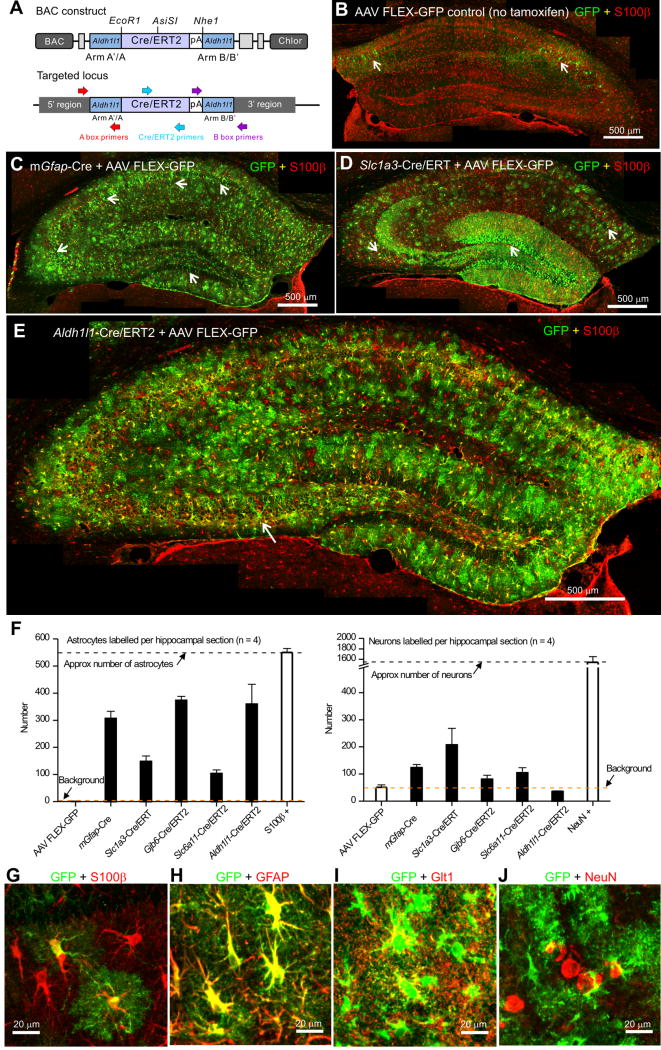
Figure 1. Creation and characterization of Aldh1l1-Cre/ERT2 BAC transgenic mice.
A. Schematic showing the BAC targeting construct used to create the Aldh1l1-Cre/ERT2 transgenic mice (key primer locations are also shown). B. Representative montage of the hippocampus from the Aldh1l1-Cre/ERT2 transgenic mouse injected with AAV FLEX-GFP virus with no tamoxifen injection. The white arrows show leaky expression of GFP in neurons. C. Representative montage of the hippocampus from the mGfap-Cre transgenic mouse injected with AAV FLEX-GFP virus stained for GFP (green) and S100β (red). There was expression of GFP in astrocytes; the white arrows show expression of GFP in neurons within the CA1, CA3 and dentate gyrus. D. Representative montage of the hippocampus from a Slc1a3-Cre/ERT2 transgenic mouse injected with AAV FLEX-GFP virus, followed by 75 mg/kg i.p. tamoxifen for 5 consecutive days. E. Representative montage of the hippocampus from an Aldh1l1-Cre/ERT2 transgenic mouse injected with AAV FLEX-GFP virus, followed by 75 mg/kg i.p. tamoxifen for 5 days. There was abundant, widespread expression in astrocytes; the white arrow shows GFP expression in one neuron. F. Bar graphs showing the number of astrocytes and neurons in hippocampal montages from each transgenic line following AAV FLEX-GFP virus injection. White bars show the total number of S100β positive astrocytes, the number of neurons observed in controls without tamoxifen injection and the total number of NeuN positive neurons in hippocampal montages. G–J. Representative high magnification images of CA1 astrocytes in the Aldh1l1-Cre/ERT2 mouse showing co-staining for S100β (G), GFAP (H), Glt1 (I), but not NeuN (J). In B–G, the sections were stained for GFP (green) and S100β (red).

