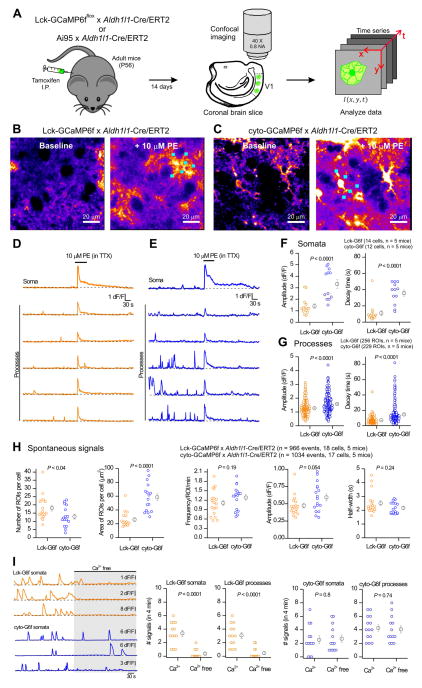
Figure 4. Visual cortex astrocytes from Lck-GCaMP6fflox x Aldh1l1-Cre/ERT2 and Ai95 x Aldh1l1-Cre/ERT2 double transgenic mice display spontaneous and PE-evoked calcium signals.
A. Schematic of the approach/workflow for imaging of astrocyte calcium signals in brain slices. B. Representative images of baseline calcium signals in V1 visual cortex astrocytes, before and during 10 μM phenylephrine (PE) in Lck-GCaMP6fflox x Aldh1l1-Cre/ERT2 double transgenic mice. C. As in B, but for Ai95 x Aldh1l1-Cre/ERT2 double transgenic mice expressing cyto-GCaMP6f. D. Representative traces of calcium signals in the soma and processes of the astrocyte from the Lck-GCaMP6fflox x Aldh1l1-Cre/ERT2 double transgenic mouse shown in B. E. Representative traces of Ca2+ signals in the soma and processes of the astrocyte from the Ai95 x Aldh1l1-Cre/ERT2 double transgenic mouse shown in C. F–G. Scatter plots of PE-evoked calcium signal amplitude and decay times from the somata (F) and processes (G) of visual cortex astrocytes of the Lck-GCaMP6fflox x Aldh1l1-Cre/ERT2 and Ai95 x Aldh1l1-Cre/ERT2 double transgenic mice, respectively. H. Scatter plots of spontaneous calcium signal properties in astrocyte processes from Lck-GCaMP6fflox x Aldh1l1-Cre/ERT2 (Lck-G6f) and Ai95 x Aldh1l1-Cre/ERT2 (cyto-G6f) double transgenic mice. I. Representative traces and average data for the effect of Ca2+ free buffers on Ca2+ signals measured with Lck- and cyto-GCaMP6f in astrocyte somata and processes. The data are from 5 mice in panels A–H and for 4 mice for panel I. Sometimes the bars representing the s.e.m. are smaller than the symbol used for the mean.

