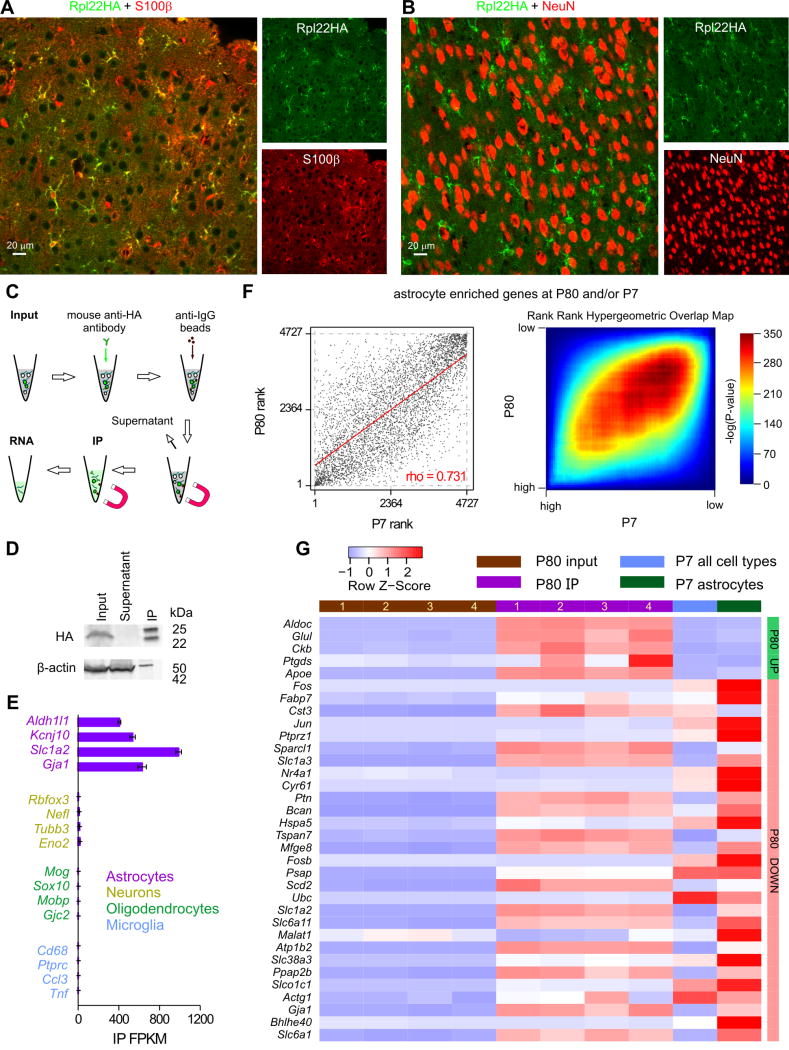
Figure 7. Aldh1l1-Cre/ERT2 x RiboTag mice and the determination of the cortical astrocyte transcriptome at P80.
A. Representative photomicrographs of IHC data showing strong colocalisation between S100β and Rpl22HA in the visual cortex. B. Representative photomicrographs of IHC data showing no colocalisation between NeuN and Rpl22HA. C. Schematic of the workflow. D. The representative Western blot shows that Rpl22HA was preserved in the IP sample, whereas β-actin was depleted in relation to input. In contrast, there was no Rpl22HA in the supernatant. In the IP lane, the 25 and 50 kD bands are the light and heavy chains of the anti-HA antibody that was used in the IP. E. The RNAseq FPKM values of well-established markers of astrocytes, neurons, oligodendrocytes, and microglia in the IP samples are plotted as mean ± s.e.m. from four biological replicates (n = 4 mice). F. Graphs comparing expression of 4727 transcripts enriched in either P80 IP (2-fold enriched over input FDR < 0.05) or P7 astrocytes (2-fold enriched over average of all other cell types) ranked based on FPKM percentile. Genes that were not sequenced in both datasets were excluded from this list. Left: Scatter plot representing the rank of each gene in the P80 (x-axis) vs. the P7 (y-axis) dataset. Clustering along the diagonal indicates similar rank in both datasets. Right: Rank-rank hypergeometric overlap (RRHO) heatmap. Each pixel represents the significance of overlap between the two datasets (-log10(pvalue), hypergeometric test, bin size = 50). Red cells represent highly significant overlap. Color scale (right) represents a range between -log10(pvalue) = 0 (p = 1) and 350 (p = 10−350) G. A heatmap showing relative expression (row z-score) of the 32 genes whose percentile FPKM differ by at least 0.1 between highly expressed P80 and P7 cortical astrocytes determined by RRHO algorithm. These genes and their FPKM values are reported in Supp Table 2. All genes for the analysis in panel F and all the raw data are provided as part of Supplementary Excel file 1. The data used for P7 were from Zhang et al., (2014)

