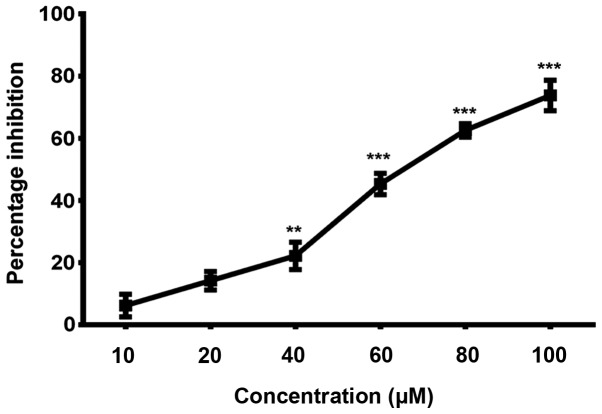
Figure 9.
Evaluation of the least cytotoxic doses of cyclocurcumin on macrophages by MTT assay. Results are expressed in terms of percentage inhibition of cell proliferation. Data are expressed as mean ± SD of results obtained from at least three independent experiments. Statistical analysis by one-way ANOVA, **P≤0.01 and ***P≤0.001.

