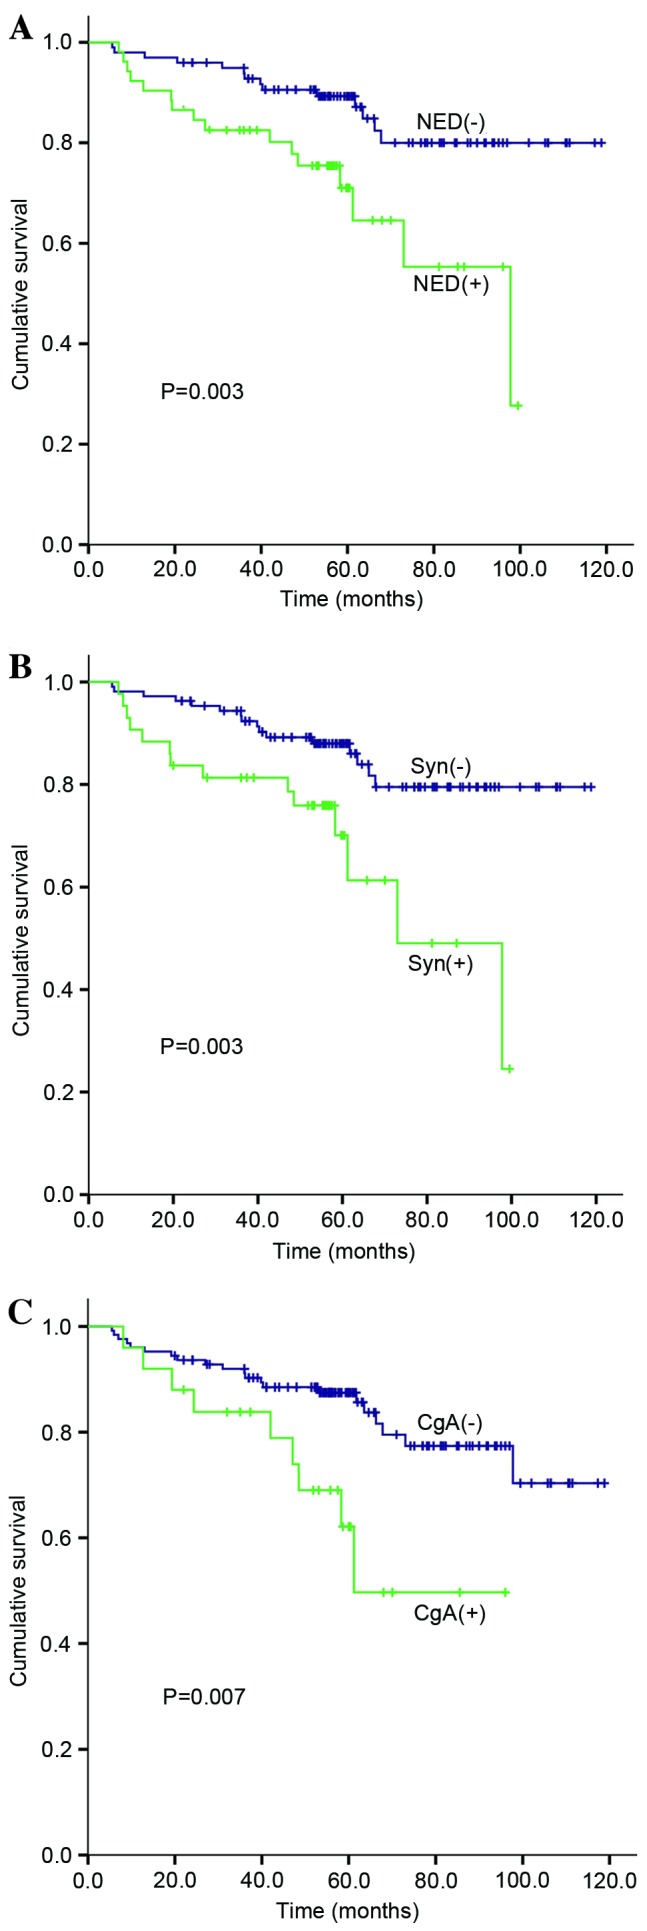
Figure 2.

Overall survival of patients with stage II colorectal cancer according to NED status. (A) The cumulative survival difference between NED(+) and NED(−) groups (P=0.003). (B) The cumulative survival difference between Syn(+) and Syn(−) groups (P=0.003). (C) The cumulative survival difference between CgA(+) and CgA(−) groups (P=0.007). NED, neuroendocrine differentiation; Syn, synaptophysin; CgA, chromogranin A.
