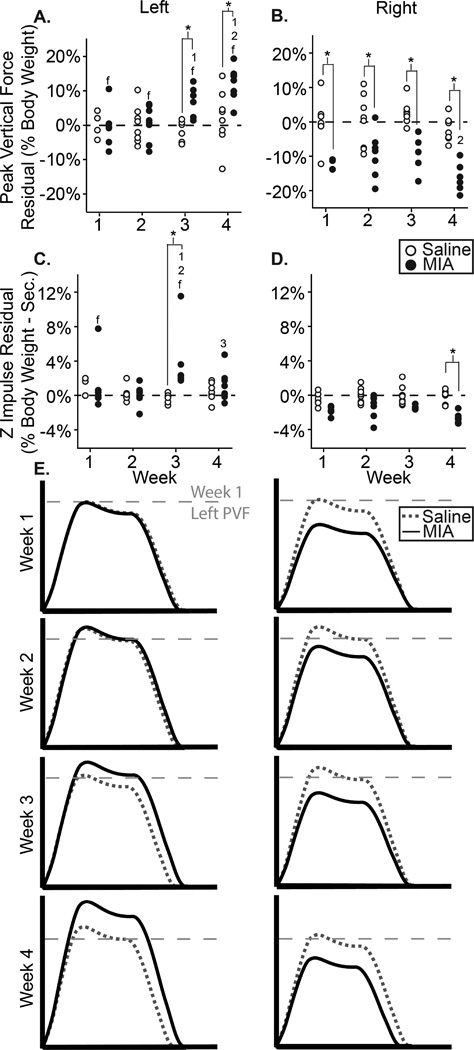
Figure 8.
8A–D: PVF (A–B) and z impulse (C–D) residual for the left and right feet of all animals in the MIA and saline groups; 8E: visual representation of MMT group dynamic changes, where the x-axis represents stance time and the y-axis represents vertical force. *: difference between indicated groups; 1–3: difference from indicated week; f: difference between feet of the same group.

