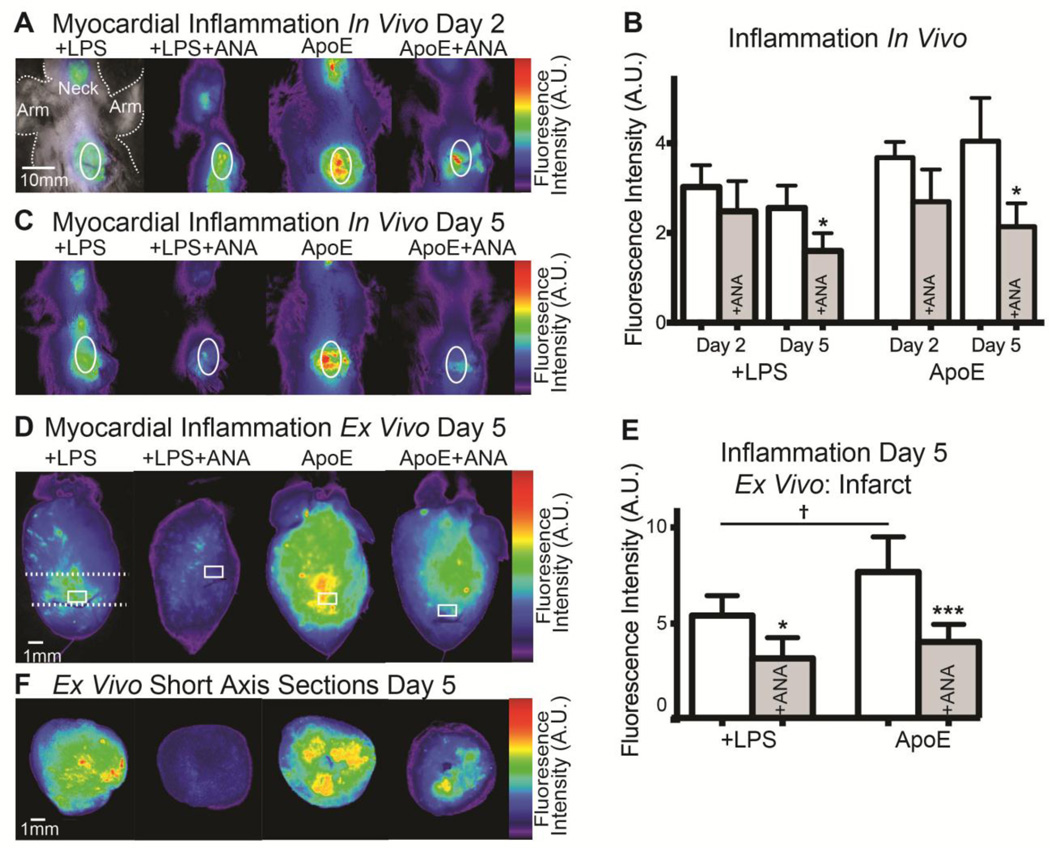
Figure 2.
A) In vivo imaging of ProSense750 at day 2 post-MI. White oval indicates heart. The neck also shows mild inflammation due to a surgical incision to ensure intubation. B) No significant differences in myocardial inflammation are observed at day 2, but significant reductions are observed by day 5 in both ANA-treated groups. C) In vivo imaging of ProSense750 at day 5 post-MI. D) Ex vivo imaging of ProSense750 from isolated hearts at day 5 post-MI. White box indicates infarct region of interest (ROI). E) Quantification of ex vivo infarct ROI fluorescence. F) Ex vivo imaging of ProSense750 in short-axis slices. Dashed white line in (D) indicates location of slice. *p<0.05, ***p<0.001 +LPS vs. +LPS+ANA or ApoE vs. ApoE+ANA. †p<0.05 +LPS vs. ApoE.

