Figure 4.
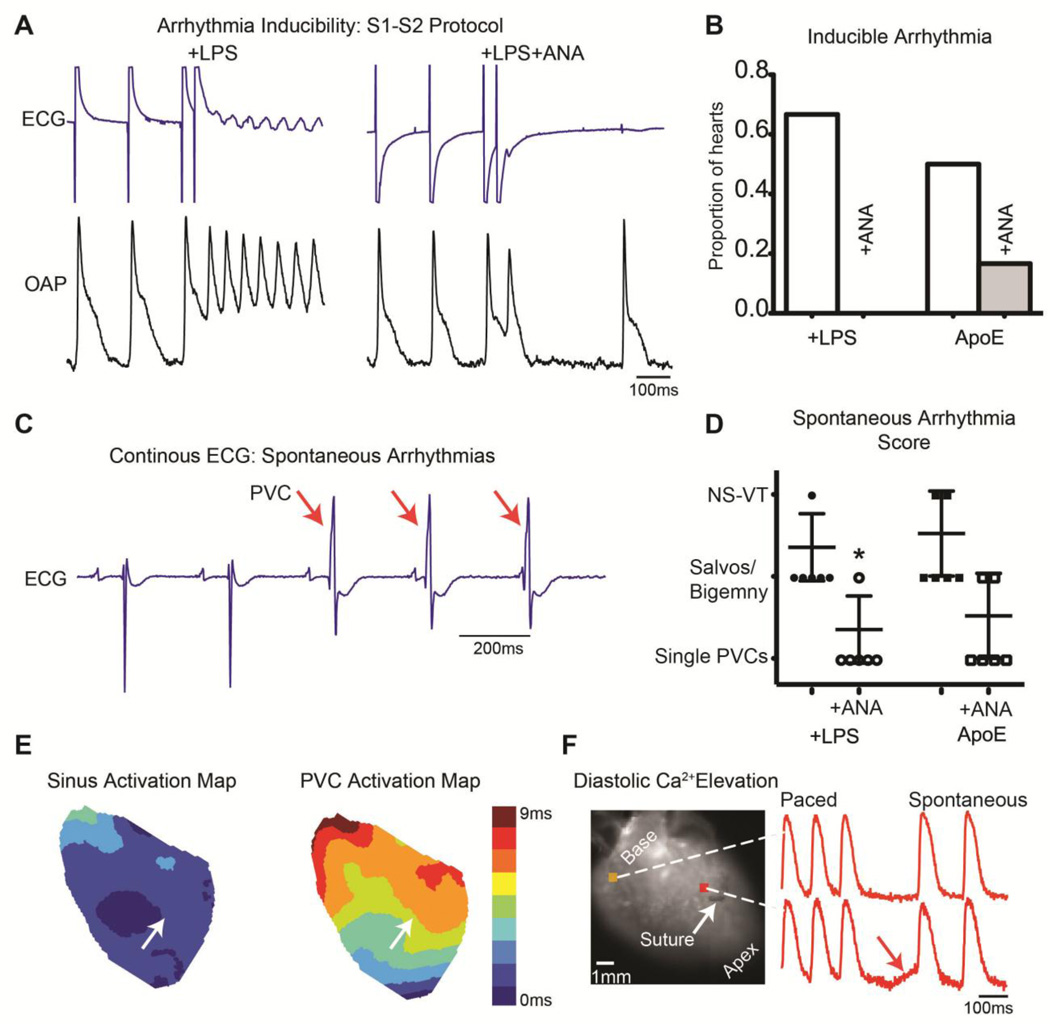
A) Example S1–S2 pacing protocol in which a reentrant arrhythmia was induced in a +LPS but not +LPS+ANA heart. B) Proportion of hearts with inducible arrhythmias. C) Example ECG from an ApoE heart with 3 spontaneous PVCs indicated with red arrows. D) ANA treatment significantly reduced the severity of spontaneous arrhythmias in +LPS hearts. E) Activation map during sinus rhythm (left) and PVC (right) from a +LPS heart. White arrow indicates suture location. Note the slower total activation time and different pattern of activation during the PVC, with earliest activation emerging apical to the infarct. F) Example of diastolic Ca2+ elevation following rapid pacing. The final 3 paced beats are shown followed by a diastolic interval in which spontaneous diastolic Ca2+ elevation is observed in the infarct region of an untreated ApoE heart. In this example, diastolic Ca2+ elevation is interrupted by a sinus beat. *p<0.05 +LPS vs. +LPS+ANA.

