Figure 6.
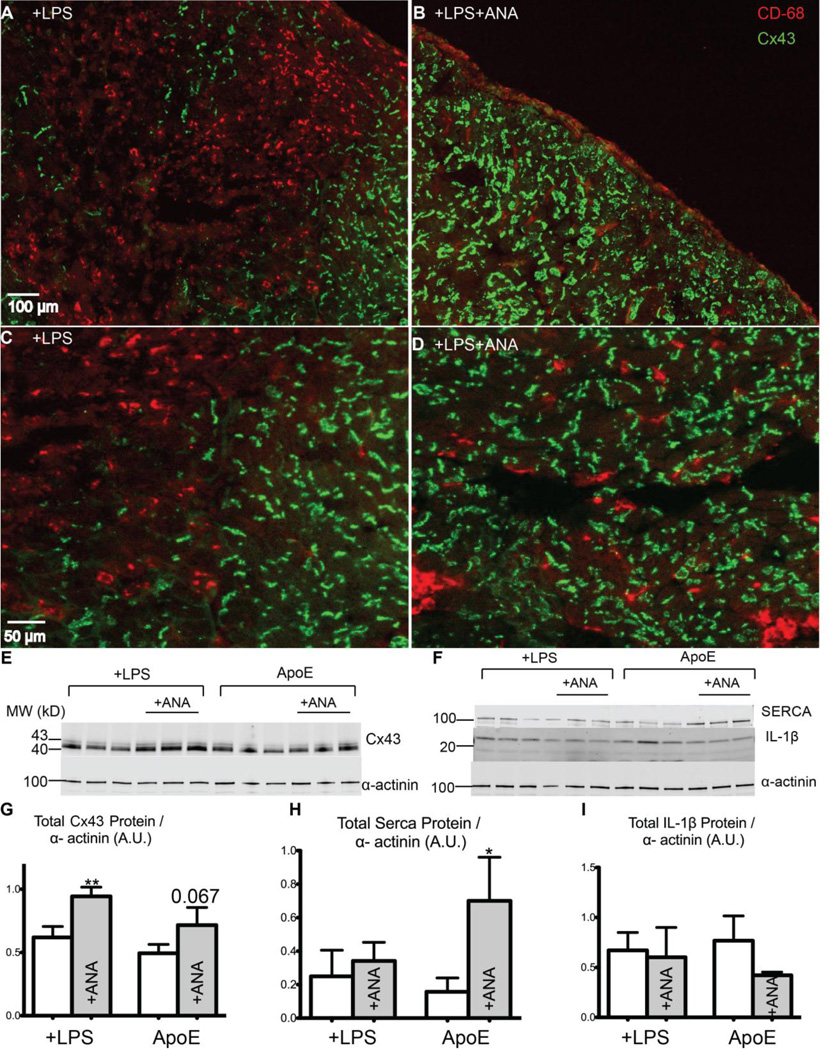
A–B) Immunohistochemistry images of the infarct area of a +LPS (A) and a +LPS+ANA (B) heart with CD68 staining for macrophages (red) and Cx43 staining (green). Note the abundant CD68-positive staining in the infarct region of the +LPS heart. C) Magnified image showing a near-complete loss of Cx43 in CD68-positive areas of a +LPS heart. D) Robust Cx43 expression in a +LPS+ANA heart, even in areas of CD68-positive cells. E) Immunoblot of Cx43 and α-actinin (loading control). F) Immunoblot of SERCA, IL-1β, and α-actinin. G) Total Cx43 protein expression. H) Total SERCA protein expression. I) Total IL-1β protein expression. *p<0.05, **p<0.01 +LPS vs. +LPS+ANA or ApoE vs. ApoE+ANA.

