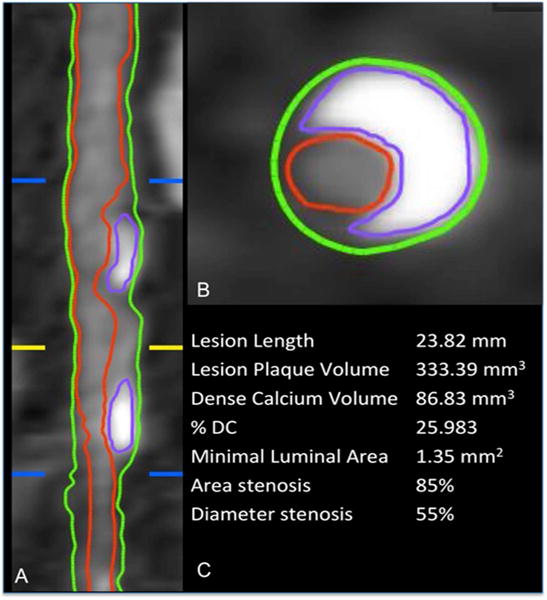
Fig. 1. Analysis of atherosclerotic plaque on CCTA.

The proximal and distal borders of the lesion identified (blue lines), is the section of maximal stenosis (yellow line). The vessel (green outline) and luminal (red outline) borders are identified, and the volume in between represents the lesion plaque volume (LPV). In luminal and cross-sectional view, the various plaque components are identified. Dense calcium is identified (purple outline) (DCV). This, along with all other plaque components comprises LPV. %DC = DCV ÷ LPV × 100. In this example, DCV = 86.8 mm3, LPV = 333.4 mm3, and %DC = 26.0%.
