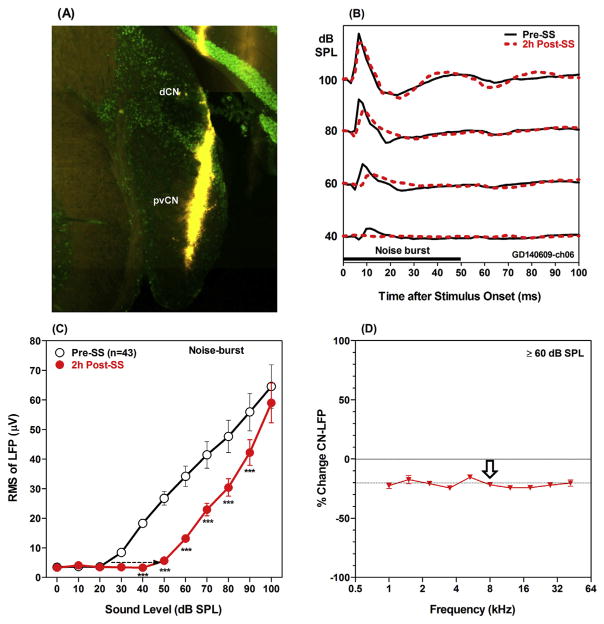
Fig. 2.
SS induced changes in CN LFP amplitude. (A) Photomicrograph showing fluorescent DiI (red) mark of the location of the multichannel electrode in the posterior-ventral cochlear nucleus (pvCN). Fluorescent (green) NeuN antibody used to label neurons. (B) Representative LFP waveforms in the pvCN elicited by noise bursts (50 ms duration, 1 ms rise/fall time) at intensities from 40 to 100 dB SPL. Data show pre- (black solid lines) and 2 h post-SS treatment (red dashed lines). (C) Mean (± SEM, n = 43) CN LFP amplitude as a function of intensity pre- (black open circles) and 2 h post-SS (red filled circles). Asterisks indicate pre-post differences that were statistically significant. (D) Average (± SEM, n = 43) percent change in CN LFP amplitude for intensities from 60 to 100 dB SPL plotted as a function of frequency.

