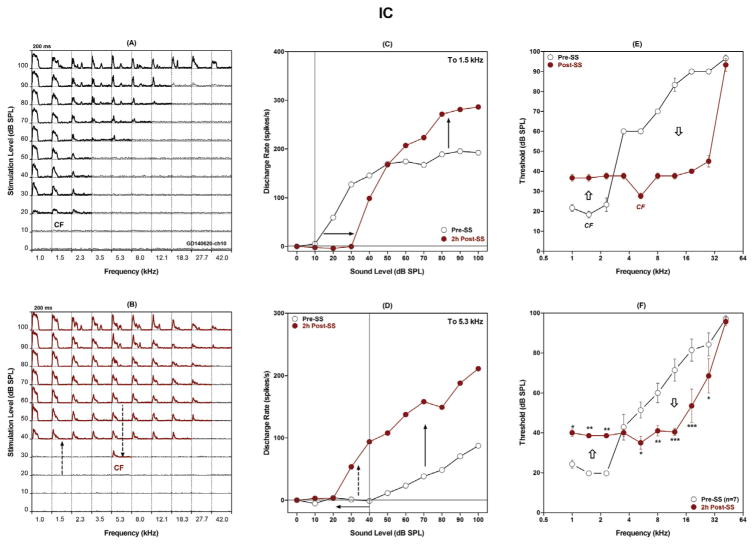
Fig. 6.
SS induced CF shift and enhanced firing rates in low-frequency IC multiunit clusters. (A) Baseline (Pre) frequency-intensity matrix of PSTH of a multiunit cluster. Each cell shows the PSTH (200 ms window) elicited with 50 ms tone bursts at the designated frequency-intensity combination. Pre-treatment CF was ~1.5 kHz and CF-threshold was approximately ~20 dB SPL. (B) Frequency-intensity matrix of PSTH of the multiunit cluster obtained 2 h post-SS. Note threshold increases of approximately 20 dB from 1 to 2.3 kHz (up arrow) and threshold decreases of 20 dB or more from 3.5 to 18.3 kHz (down arrow). (C) Discharge rate-intensity function of the IC multiunit cluster at 1.5 kHz pre- (black open circles) and 2 h post-SS (red filled circles). Note a response threshold at 10 dB SPL (vertical line) and ~20 dB threshold loss 2 h post-SS (rightward arrow) and increase in suprathreshold firing rates (up arrow). (D) Discharge rate-intensity function of the IC multiunit cluster at 5.3 kHz pre- (black open circles) and 2 h post-SS (red filled circles). Note a response threshold at 40 dB SPL (vertical line) and ~20 dB gain of response threshold 2 h post-SS (leftward arrow) and increase in firing rate at suprathreshold intensities (solid up arrow) and sound levels previously below threshold (dashed up arrow). (E) Mean of 3 pre-SS FRFs (collected during 3 h prior to the SS-treatment from this representative multiunit cluster, black open circles) and of 3 post-SS FRFs (post-1h, 2 h, and 3 h, red filled circles). Note threshold increases (up arrow) of approximately 20 dB near 1.5 kHz and large threshold decreases (down arrow) at higher frequencies that resulted an upward shift in CF post-SS from ~1.5 kHz to 5.3 kHz. (F) Mean (± SEM) FRFs of seven low-CF multiunit cluster measured pre- (black open circles) and 2 h post-SS (red filled circles). Note SS-induced threshold increases (up arrow) of approximately 20 dB from 1 to 2.3 kHz and large threshold decreases (down arrow) at higher frequencies. Asterisks indicate pre-post changes that were significantly different from pre-treatment.

