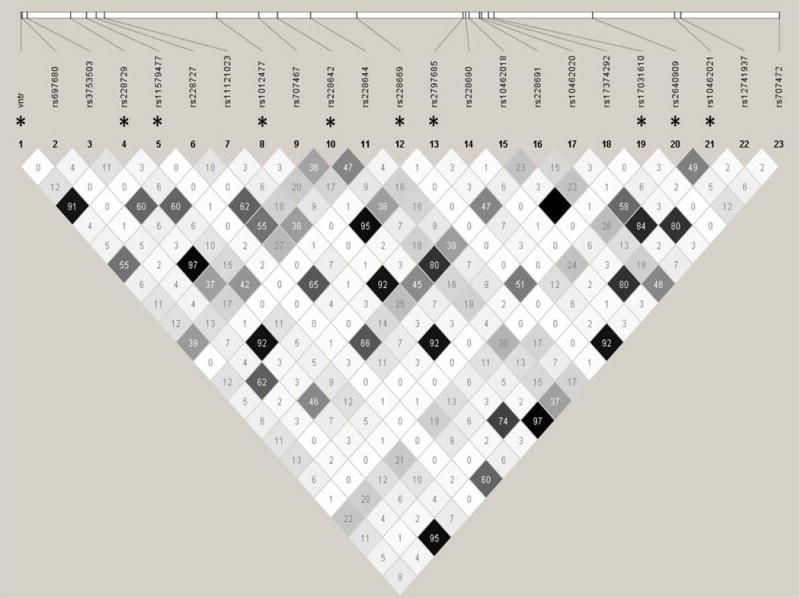
Figure 1. Linkage Disequilibrium (LD) plot of studied PER3 SNPs in patients with late life insomnia.

Asterisk * indicates a pruned list of genotyped SNPs with r2 cut off value of 0.5.

Asterisk * indicates a pruned list of genotyped SNPs with r2 cut off value of 0.5.