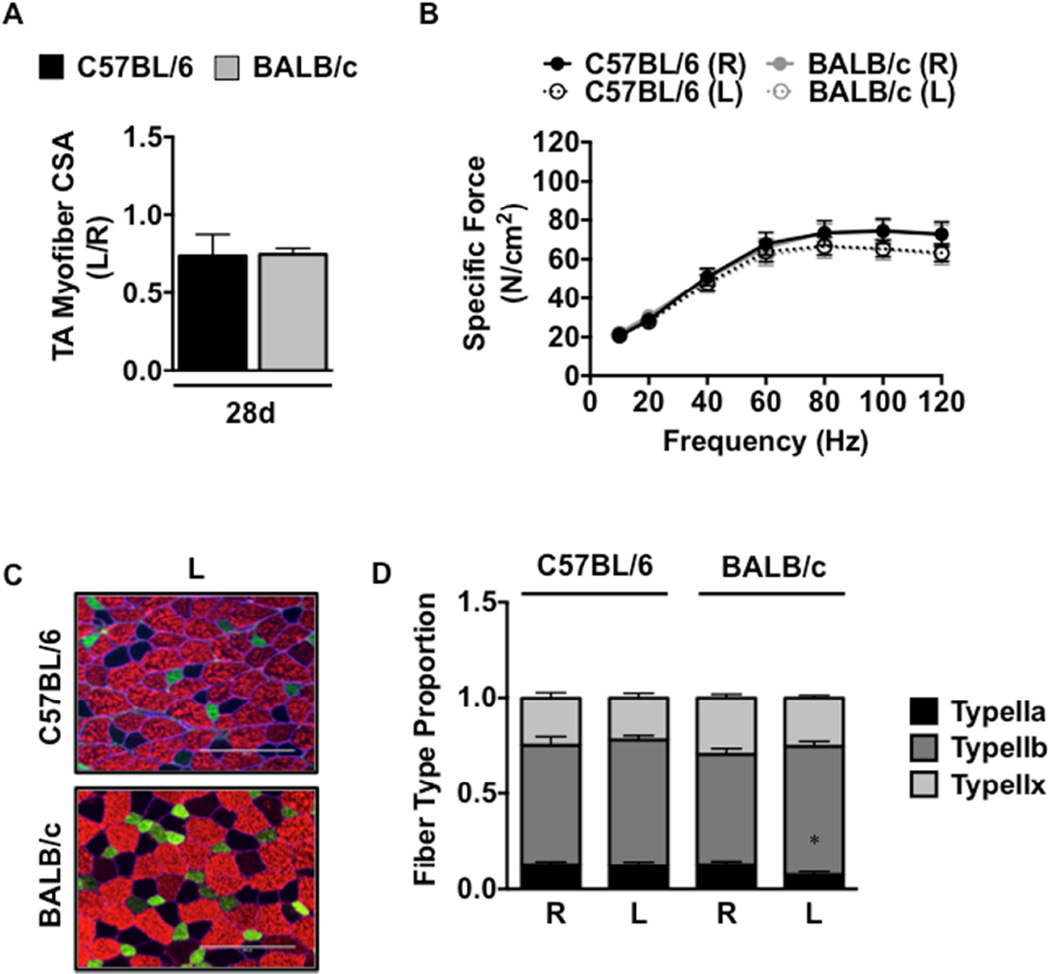
Figure 5. Muscle atrophy, morphology, and force production after a non-ischemic injury.
Non-ischemic muscle regeneration was induced by cardiotoxin (CTX) injection. A. Sections of TA muscles were analyzed for myofiber cross sectional area (CSA) and presented as the ratio of the ischemic (L) to the non-ischemic (R) limb, mean ± SEM. B. Force frequency curves were determined in isolated EDL muscles from both strains at 28 postoperative days. C. Sections of EDL muscles were immunofluorescently labeled with selective myosin heavy chain antibodies to determine the proportion of each fiber type (IIa, IIb, IIx) present. 200µm in length(20X). (D). * P<0.05 vs. strain matched R. All data are means ± SEM and representative of N≥6/strain/time point.

